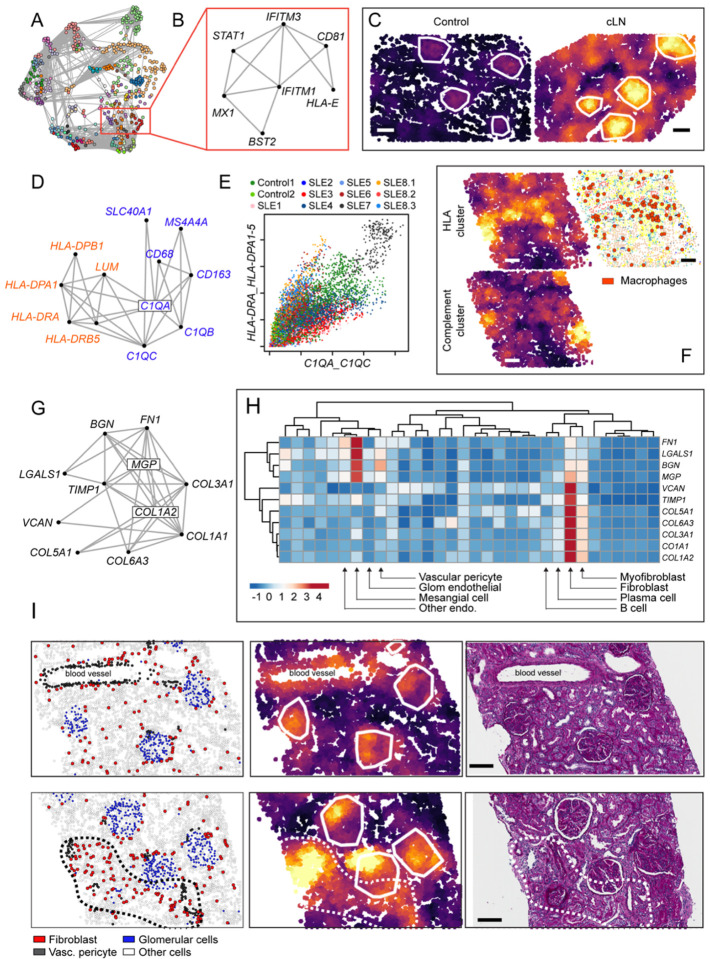
Figure 8: Spatially correlated gene modules in cLN.
(A) Network connecting spatially correlated gene pairs. Node color shows clusters of mutually correlated genes. (B) Spatial correlation network for interferon stimulated gene (ISG) module. (C) ISG module activity in representative kidney tissue from healthy control (left) and cLN (right). Scale bars, 100μm. (D) Spatial correlation network for two macrophage-associated modules (“Class II HLA cluster”, red; “Compliment cluster”, blue). (E) Neighborhood-level activity of each macrophage module across all analyzed cells (colored by sample ID). (F) Heatmap showing corresponding “HLA cluster” (upper left), “Compliment cluster” (lower left), and cell type annotation image highlighting macrophage location (red dots) from representative cLN subject. Scale bars, 100μm. (G) Spatial correlation network for fibrosis module. (H) Heatmap showing expression of individual fibrosis module genes by kidney cell type. (I) Representative cLN tissues sections (SLE6) showing corresponding cell type annotations (left), fibrosis module expression (middle), and Periodic acid–Schiff (PAS)-stained tissue sections (right). Upper panels show fibrosis module expression overlapping with glomeruli and arteriole surrounded by vascular pericytes. Lower panels highlight tubulointerstitial fibrosis module expression within an anatomical region enriched for fibroblasts (dashed line). Scale bars, 100μm.

