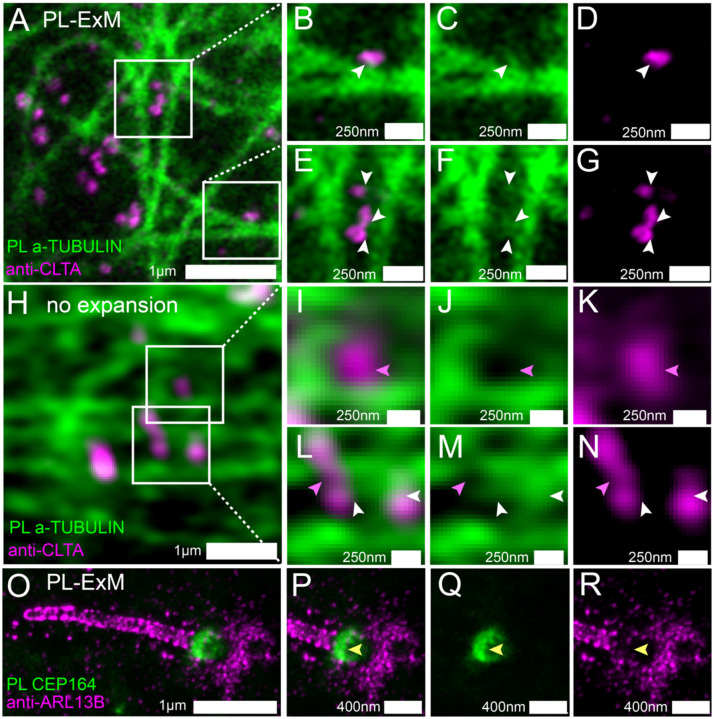
Figure 3. Two-color PL-ExM images dissect spatial relationships between interactive proteins.
(A-G) PL-ExM images of proximity-labeled a-TUBULIN (green) and immunostained CLTA (magenta) in U2OS cells. (B-G) Magnified view of the boxed regions in (A). The white arrows indicate the co-localization of CCPs and bud-like structures stemming from microtubules. (H-N) Airyscan images of proximity-labeled a-TUBULIN (green) and immunostained CLTA (magenta) in U2OS cells without expansion. (I-N) Magnified view of the boxed regions in (H). The pink arrows point at CCPs that do not co-localize with microtubules. White arrows indicate possible colocalization of CCPs and microtubule structures. (O-R) PL-ExM of proximity-labeled CEP 164 (green) and immunostained ARL13B (magenta) in a primary cilium of a MEF cell. (P-R) Magnified view of the ciliary base in (O). The yellow arrows indicate anti-localization between ARL 13B and CEP 164. (A-N) are single-slice images. (O-R) are maximum intensity projections of z stacks. The length expansion factors are 4.1 (A-G) and 8.4 (O-R). All images are taken by an Airyscan microscope. All scale bars are in pre-expansion units.

