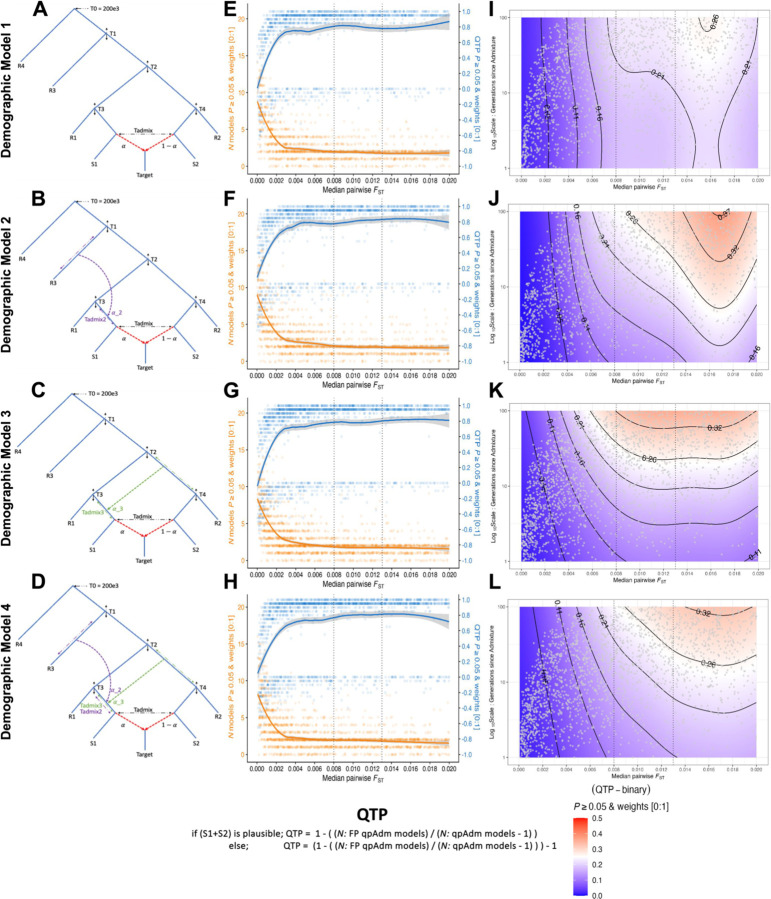
Figure 3.
Simple demographic models and qpAdm test performance (QTP). (A-D) Topological structures of the four simple demographic models. (E-H) QTP and number of plausible qpAdm models across the range of median pairwise FST values calculated on the S1, S2, R1, R2, and R3 populations. For each simulation iteration we represent the counts of the number of plausible single and two-source qpAdm models (21 is the maximum possible) with orange dots and the locally estimated scatterplot smoothing (loess) computed in R and shown with the orange line. We show the QTP value for each simulation iteration with blue dots and the loess smoothing with the blue line. (I-L) Logistic GAM probability for the QTP-binary response variable with admixture date (Tadmix) and median pairwise FST as predictor variables. The gray dots are unique combinations of simulation parameters placed in the space of predictor variables. Vertical dotted lines in plots E-L show the median pairwise FST values at the approximate Iron (0.008), and Bronze Age (0.013) periods.

