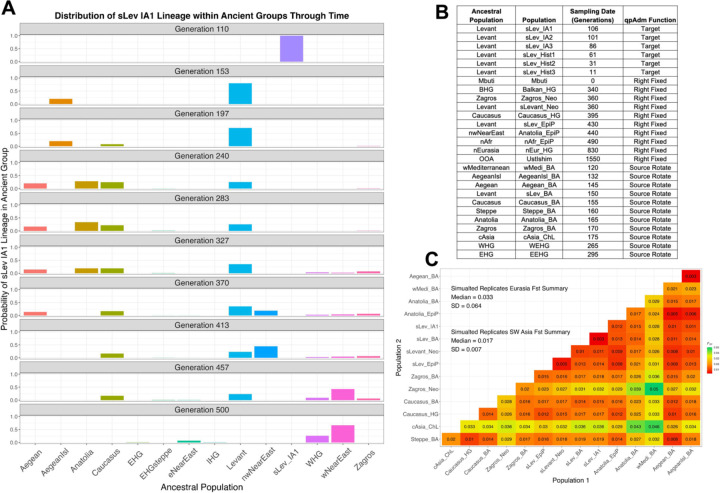
Figure 6.
(A) Barplots showing probabilities of encountering a lineage found in the “sLev IA1” group in other simulated ancestral populations (only presenting populations with non-negative probabilities). The ancestral populations are those from which we sampled and correspond to the first column in B. (B) A table of the sampled populations used in qpAdm analysis and the and the ancestral populations they split from (corresponding to ancestral populations in A). An FST matrix (C) for the sampled simulated populations is also shown.

