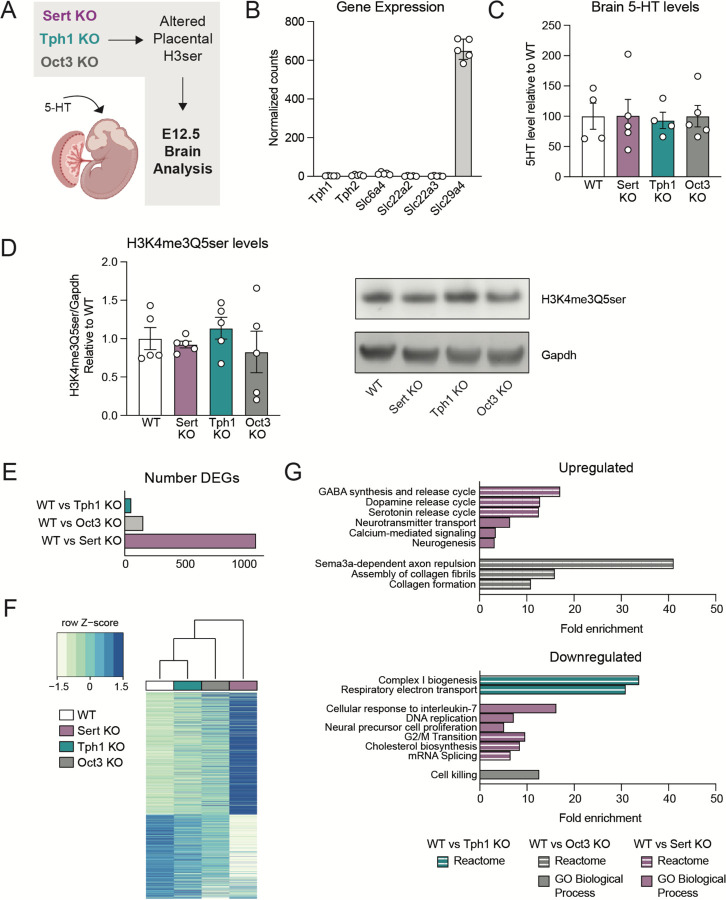
Figure 4. Offspring neurodevelopmental gene expression changes are associated with placental disruptions.
(A) Schematics of study design for investigating E12.5 offspring brain changes. (B) Normalized counts showing gene expression for Tph1, Slc6a4, and Slc22a3 are low compared to that for the transporter PMAT (Slc29a4) in embryonic brain. (C) There is no change in 5-HT levels in E12.5 brains when comparing WT vs KO tissues (one-way ANOVA, F(3,14) = 0.027, p = 0.9938). N=4–5 samples/group. (D) There also are no differences in H3K4me3Q5ser in brain tissues (one-way ANOVA, F(3,16) = 0.5861, p = 0.6328). N=5 samples/group. Data are mean ± SEM. (E) Number of differentially expressed genes from bulk RNA-sequencing comparing WT vs. Sert KO, WT vs. Tph1 KO, WT vs. Oct3 KO brain tissues at E12.5 (adjusted p < 0.05). (F) Hierarchical clustering of all differentially expressed genes relative to WT (adjusted p < 0.05). Expression values are averaged within genotype (N=5–6 samples/group). (G) Selected Reactome and GO Biological Process pathways enriched from differentially expressed genes comparing WT vs KO brain tissues at E12.5 (FDR < 0.05).

