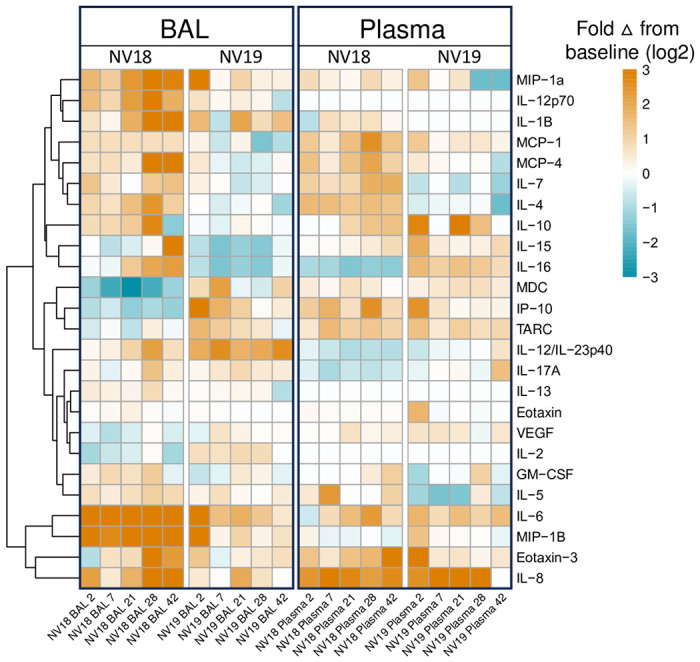
Figure 3. Meso Scale analysis of cytokine and chemokine fluctuations in blood and BAL in PTM coinfected with SIV and SARS-CoV-2.

A. Heatmap indicating changes in cytokine and chemokine levels in BAL supernatant and plasma. Data represents log2 fold change from baseline (pre-SARS-CoV-2 infection). B-YY. Line graphs illustrating cytokine, proinflammatory cytokine, and chemokine dynamics in BAL supernatant (B-H, P-W, FF-YY) and plasma (I-O, X-EE, PP-YY) before and 2-, 7-, 21-, 28-, and 42-days post SARS-CoV-2 infection.
