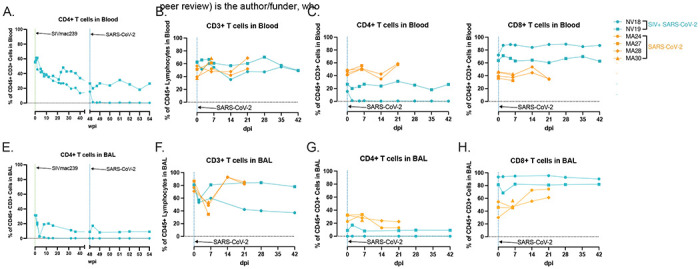
Figure 5. T cell dynamics in blood and BAL following SARS-CoV-2 infection of SIV+ and SIV naïve PTM.

CD4+ T cell kinetics in blood (A) and BAL (G), following SIVmac239 and SARS-CoV-2 infection. H-L. Peripheral and pulmonary T cell dynamics in SIV+ SARS-CoV-2 coinfected PTM (blue). Historical data from four SIV naive SARS-CoV-2 infected PTM in orange. Comparison of overall CD3+ T cell populations (B&F) as well as T cell subsets; CD4+ (C&G), CD8+ (D&H).
