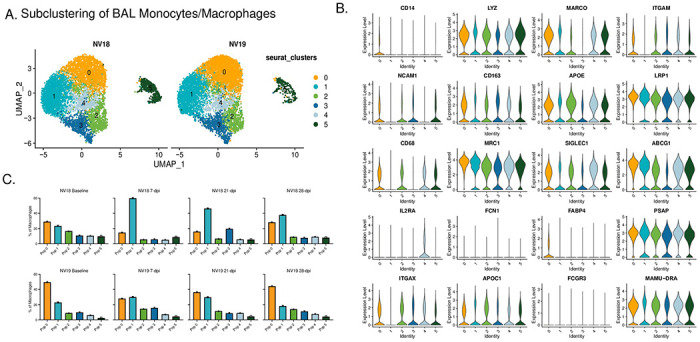
Figure 9. Monocyte/macrophage dynamics following SARS-CoV-2 inoculation of SIV+ PTM.

A. UMAP plots of pulmonary monocyte/macrophage (mono/mac) subclustering. B. Violin Plots illustrating expression of canonical monocyte/macrophage gene signatures among the Seurat-derived clusters. C. Monocyte/macrophage dynamics during SARS-CoV-2 infection.
