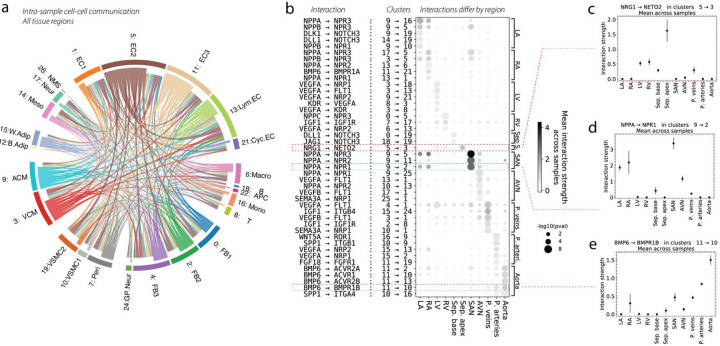
Figure 4. Cell-cell communication and its variability across the cardiovascular system.
(a) Putative cell-cell interactions, computed separately for each sample and then aggregated over samples, are shown as a chord diagram, where chords are colored by the cell type that secretes the ligand, and the width of each chord is proportional to the number of significant interactions that surpass some minimum interaction strength. (b) Dotplot that highlights cell-cell interactions which vary greatly by tissue. Rows represent particular interactions, each of which is annotated by the ligand-receptor interaction as well as the cell type clusters involved. Mean interaction strength for the ligand-receptor interaction is denoted by dot color. Dot size is a p-value for enrichment computed from a Wilcoxon test for differences in interaction strengths across tissues. The top five (or fewer) significant interactions for each tissue are shown, comprising a small part of a much longer list. The red, green, and blue dashed boxes highlight interactions which are examined in panels (c-e). (c) The interaction strength of Nrg1 from cluster 5: EC2 → Neto2 from cluster 3: VCM is shown for each tissue. Error bars represent the standard deviation across samples. This interaction is clearly quite enriched in the septum apex. (d) Similar plot for the interaction of Nppa from cluster 9: ACM → Npr1 from cluster 2: FB2, which shows a pattern of atrial enrichment. (e) Similar plot for the interaction of Bmp6 from cluster 11: EC3 → Bmpr1b from cluster 10: VSMC1, which is enriched in the vasculature and the aorta in particular.

