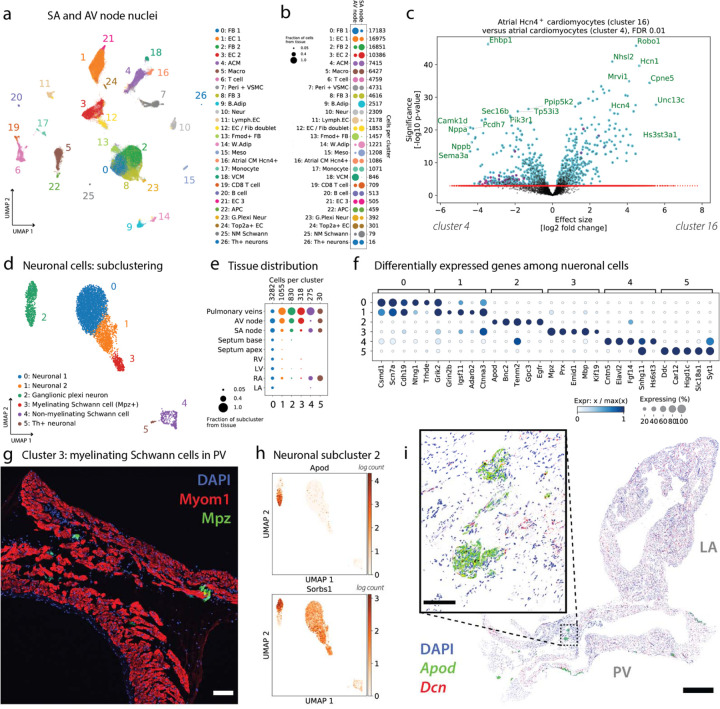
Figure 6. Cardiac conduction: nodal and neuronal cell populations.
(a) UMAP of all 108,063 nuclei from the SAN and AVN, clustered and annotated. Cluster 16 captures the nodal pacemaker CMs. (b) Representation of clusters in the SAN and AVN. (c) Volcano plot shows the results of a differential expression test between the nodal pacemaker CMs and atrial CMs. Both cell types are present in the same samples, eliminating confounding batch effects. (d) Subclustering of all 5790 neuronal cells from the atlas yields 6 subtypes. (e) Distribution of neuronal subtypes across cardiovascular tissues. (f) Top marker genes for each neuronal subtype. (g) Immunofluorescence imaging of Mpz+ (green) subcluster 3, the myelinating Schwann cells in PV tissue. Tissue was counterstained with the nuclear marker DAPI (blue) and the CM marker Myom1 (red). Myelinating Schwann cells make contact with CMs. Scale bar is 100 microns. (h) The genes Apod and Sorbs1 are expressed in different subsets of neuronal subcluster 2. (i) RNAscope image (white background) of tissue section containing LA and PV, staining Apod (green) and Dcn (red; FB marker). Tissue was counterstained with the nuclear marker DAPI (blue). Inset shows groups of Apod+ cells. Full field of view scale bar is 1mm, and the inset scale bar is 100 microns.

