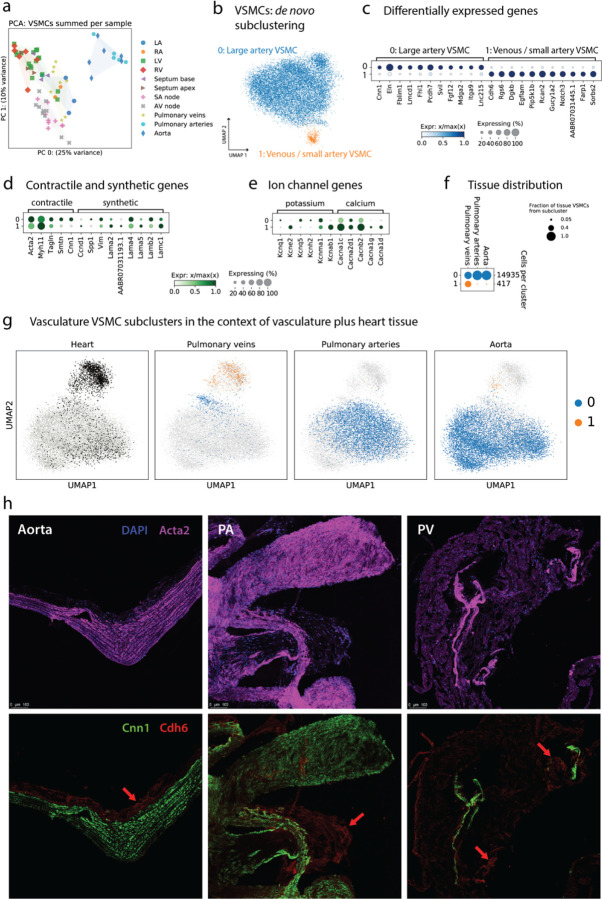
Figure 8. Distinct subtypes of VSMCs in the vasculature.
(a) Pseudobulk variation in VSMC transcription. Each dot is the summed expression of all VSMCs from one sample. Coloring by tissue shows that the PA and Ao samples clearly separate from other tissues in the top principal component. (b) Subclustering of the VSMCs from PV, PA, and Ao samples reveals 2 subtypes. (c) Marker genes of each subcluster show clear distinctions. (d) Dotplot showing the expression of a few canonical contractile and synthetic genes in each subcluster. (e) Dotplot highlighting a few potassium and calcium channel genes which show different patterns of expression in the two subclusters. (f) Distribution of the two VSMC subclusters in PV, PA, and Ao shows that subcluster 1 is nearly absent in PA and Ao. (g) UMAPs show all VSMCs from all tissues in light gray, with tissue-specific VSMCs highlighted in black for heart and subcluster color (blue, orange) for PV, PA, and Ao. (h) Immunofluorescence imaging of Acta2 (all VSMCs), Cnn1 (subcluster 0), and Cdh6 (subcluster 1) confirms the presence of these cells in PV, PA, and Ao. Subcluster 1 makes up a larger share of VSMCs in PV, in agreement with panel f.

