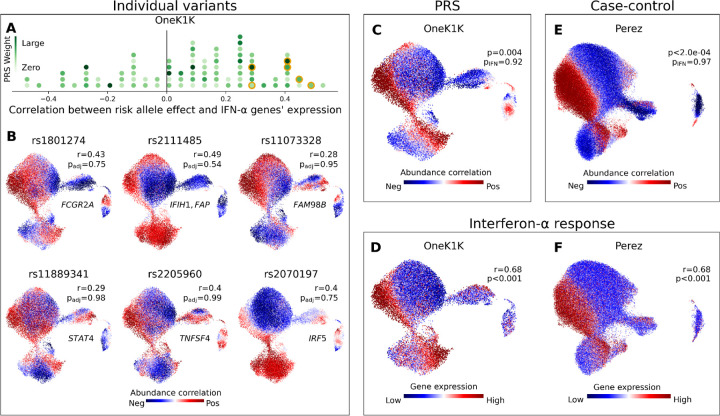
Figure 4: Polygenic risk scores aggregate the effects of individual loci to highlight disease-relevant cell states, a valuable point of comparison to single-cell case-control analyses.
(A) Histogram of SNPs in the SLE PRS. For each SNP, we plot the Pearson’s r correlation across OneK1K myeloid neighborhoods between the SLE risk-associated phenotype and an IFN-α response gene signature. The marker for each risk allele is colored according to its effect weight in the PRS. Six SNPs plotted in (B) are highlighted in orange. (B) We show six SNPs in the SLE PRS for which the myeloid cell state abundance correlations to the SLE risk allele correspond closely to an IFN-α response signature. For each selected SNP, we plot a UMAP of OneK1K myeloid cells colored by the abundance correlation per neighborhood to dose of the risk allele. We also report the gene(s) to which the SNP has been mapped, the Pearson’s r correlation between the neighborhood-level phenotype and IFN-α response signature, and the FDR-adjusted CNA global p-value. (C) Myeloid cell state abundance shift associated with increasing SLE PRS value in the OneK1K cohort. CNA global p values are shown with (pIFN) and without (p) controlling for mean IFN-α response gene expression per individual. (D) IFN-α response gene expression per neighborhood among myeloid cells in the OneK1K cohort. Pearson’s r between IFN-α response per neighborhood and the PRS phenotype from (C) is shown, with associated bootstrapped p-value for r>0. (E) Myeloid cell state abundance shift associated with SLE disease status in the Perez et al. European cohort. CNA global p-values are shown with (pIFN) and without (p) controlling for mean IFN response gene expression per individual. (F) IFN response gene expression per neighborhood among myeloid cells in the Perez et al. European cohort. Pearson’s r between IFN response per neighborhood and SLE phenotype from (E) is shown, with associated bootstrapped p-value for r>0.

