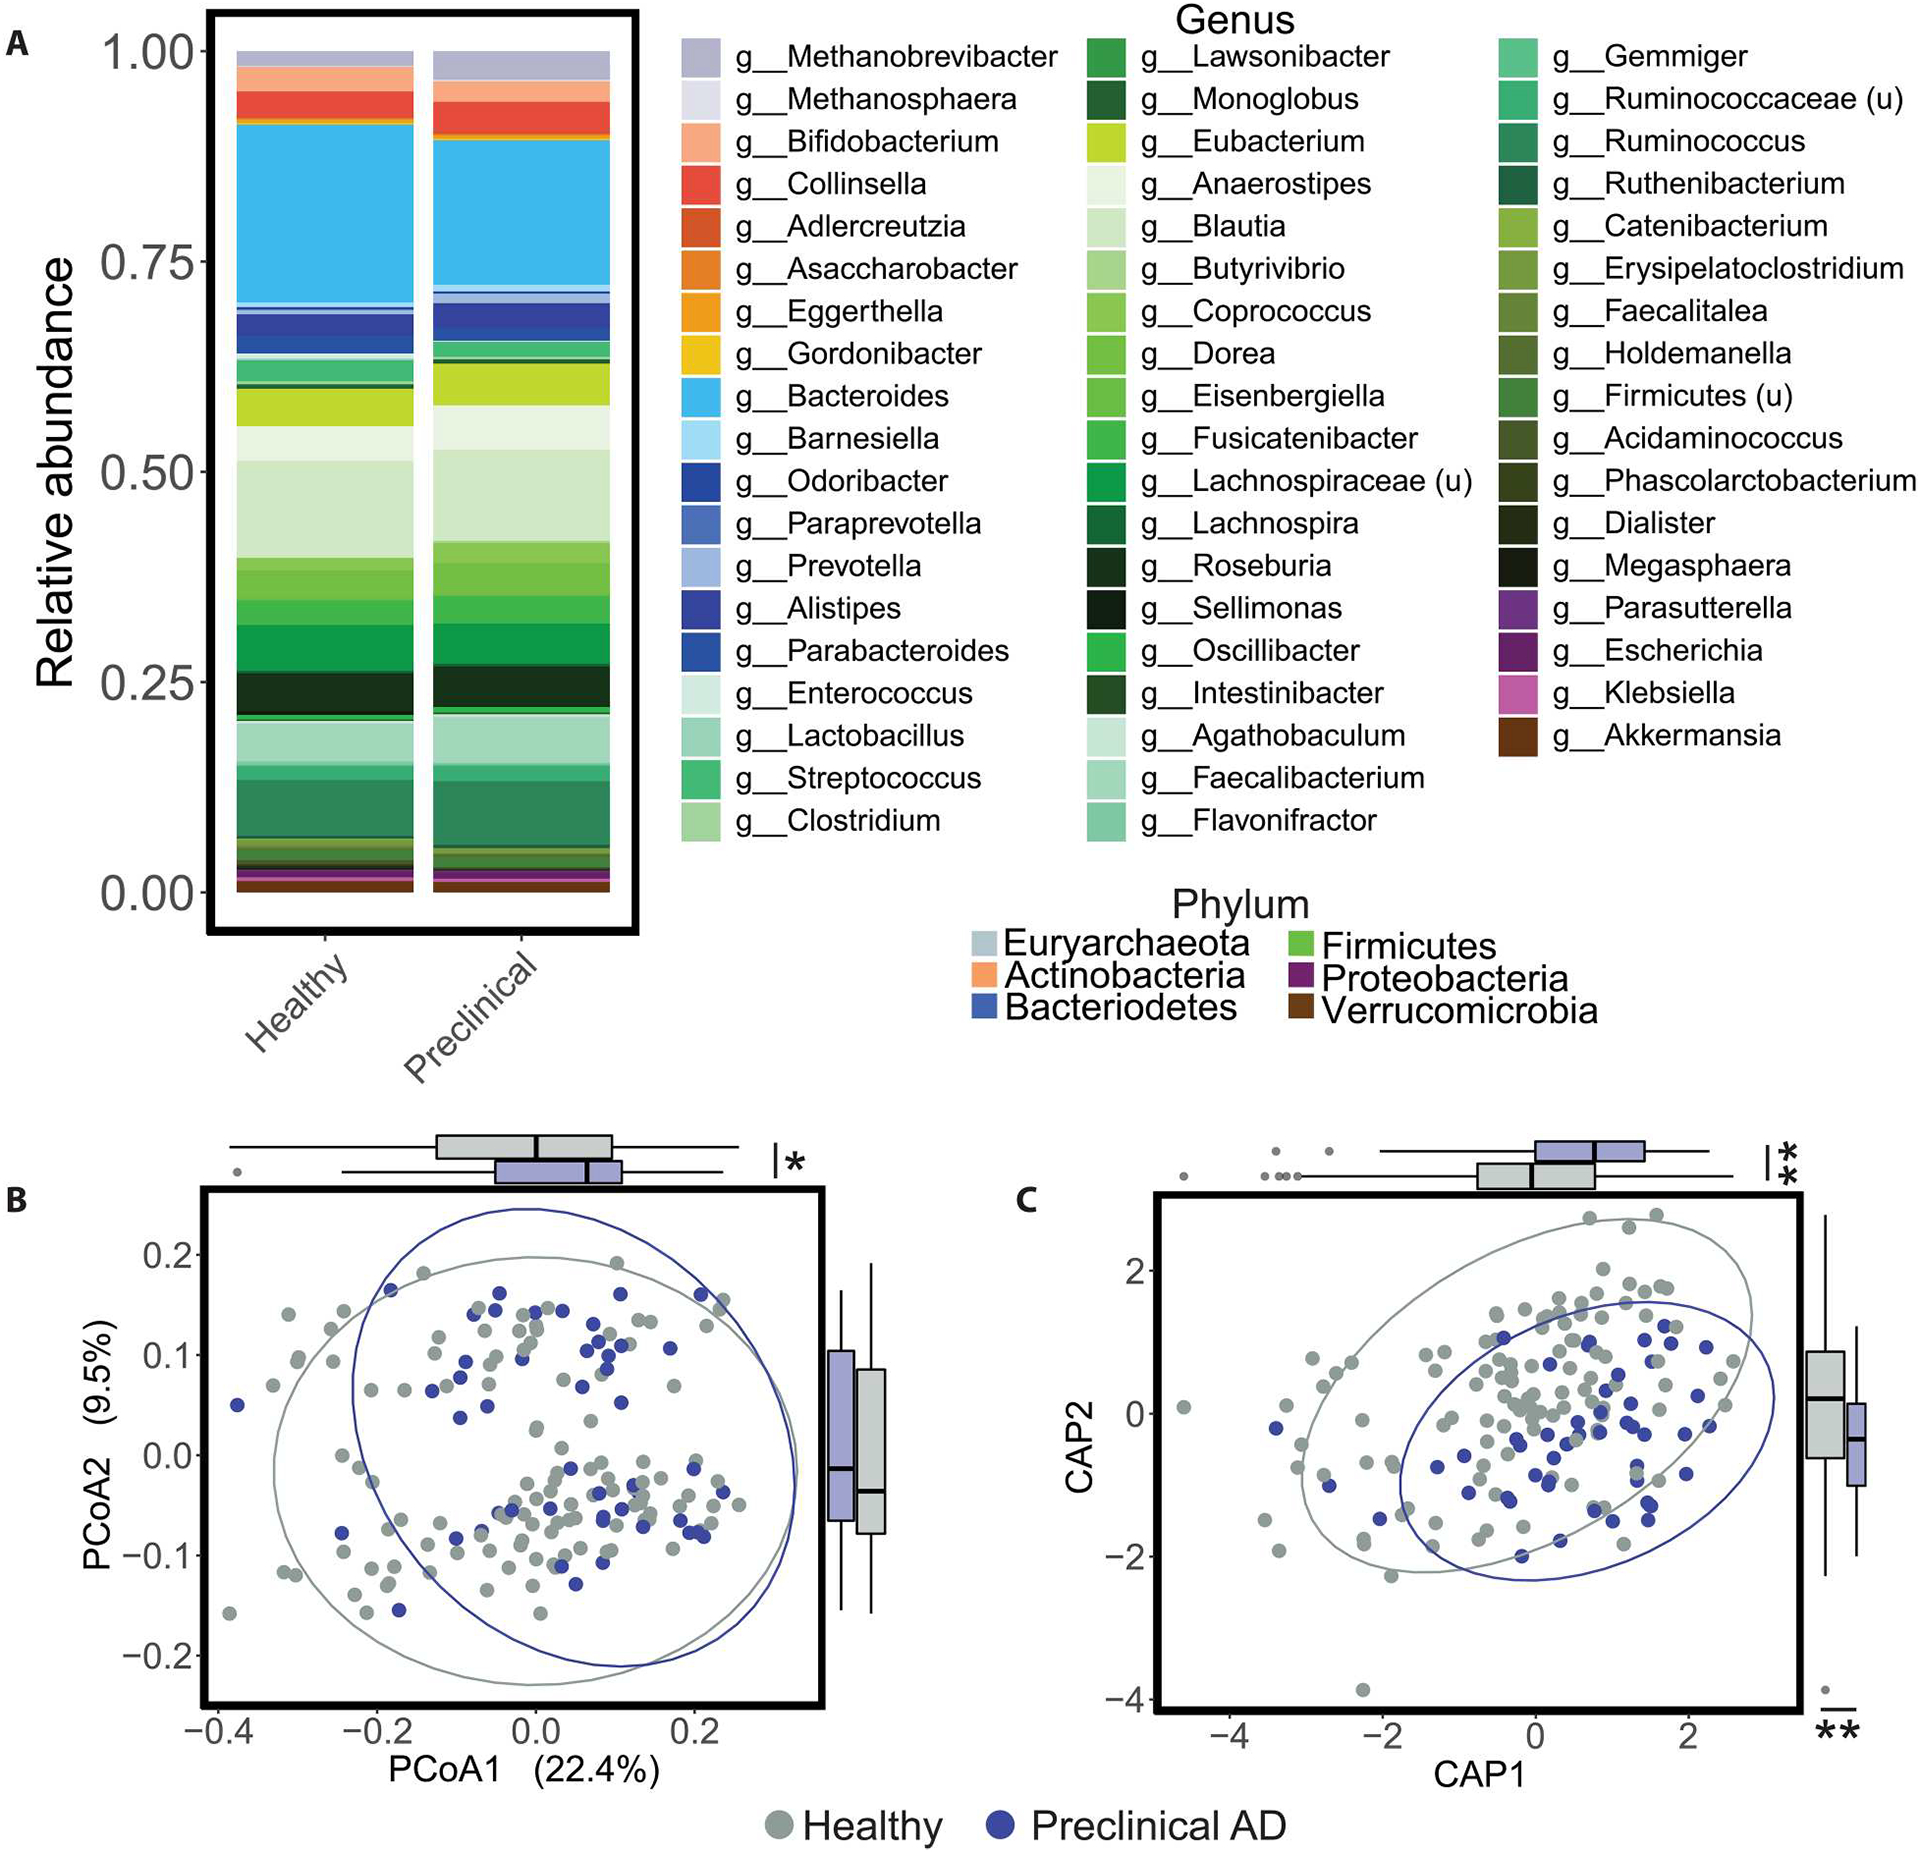
Fig. 1. Healthy and preclinical AD individuals have distinct gut microbiome profiles.

(A) Stacked taxonomic (MetaPhlAn3) bar plots at the genus level stratified by preclinical AD status are shown, with color grouping at the phylum level. u, unclassified. (B) The PCoA on unweighted UniFrac distances was calculated from the MetaPhlAn3 taxonomic profiles. Global microbiome composition was different between healthy and preclinical AD individuals after accounting for age, APOE ɛ4 carrier status, diabetes, body mass index, hypertension, and time elapsed between PET imaging or lumbar puncture for Aβ quantification and stool collection (P = 0.039, PERMANOVA; table S2). In addition, coordinates of healthy and preclinical AD samples were different along the PCoA axis 1 (P = 0.046, Student’s t test). (C) Corresponding CAP ordination on unweighted UniFrac distances was calculated from the MetaPhlAn3 taxonomic profiles using the same terms as the PERMANOVA in (B) (preclinical AD status P = 0.038, PERMANOVA; table S3). In addition, sample coordinates along the CAP1 and CAP2 axes differed by AD status (P = 0.001, Student’s t test). Ellipses represent 95% confidence bounds around group centroids. *P < 0.05 and **P < 0.01. Student’s t test; P values were adjusted using the Benjamini-Hochberg method.
