
Fig. 2. Gut microbiome profiles correlate with Aβ and tau but not neurodegeneration.
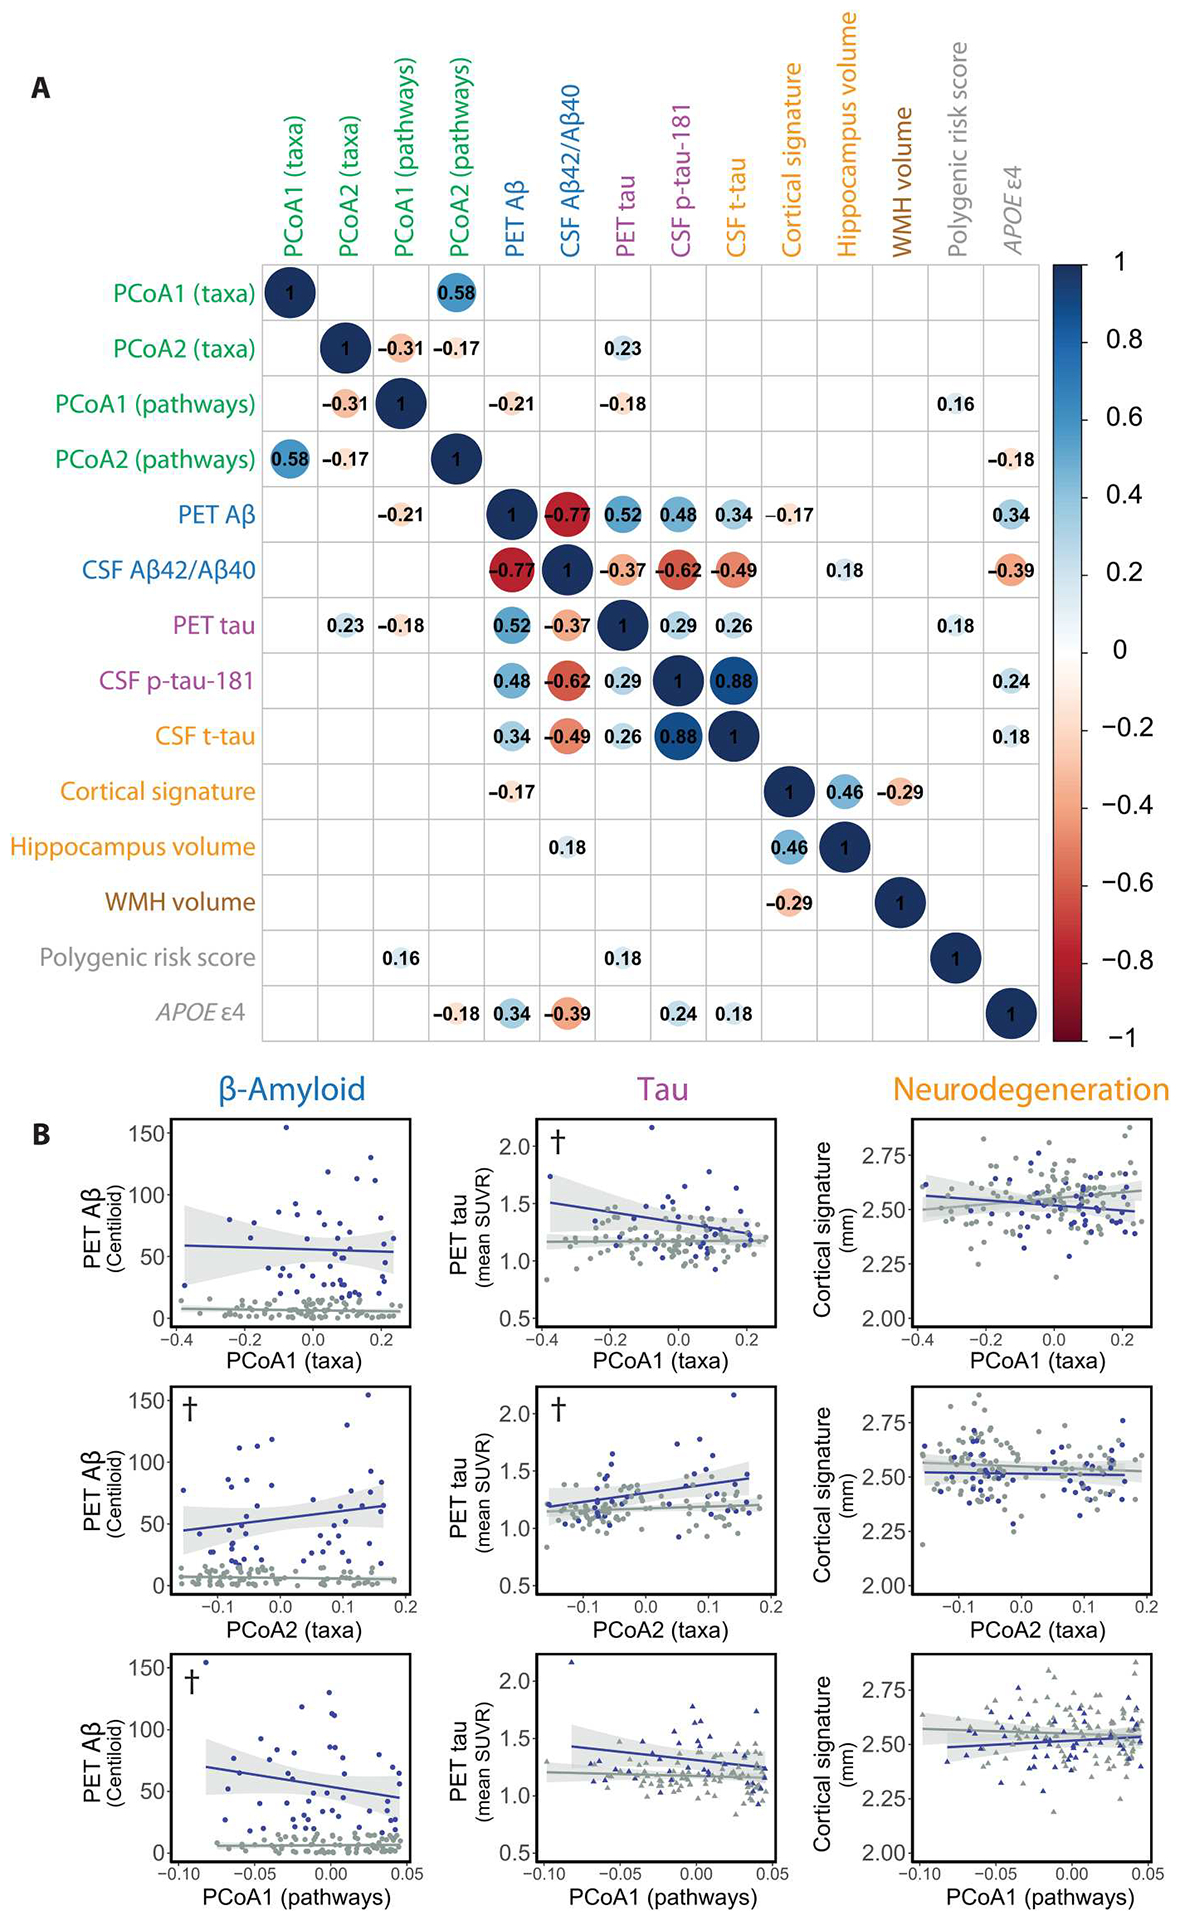
(A) Pairwise Spearman correlations between microbiome summary metrics (green) and AD biomarkers (blue, Aβ; purple, tau; orange, neurodegeneration; brown, vascular injury; gray, genetic risk factors). Significant correlations are shown (P < 0.05, Benjamini-Hochberg adjusted), with the size of the circle inversely proportional to the P value. Inset values are Spearman correlations. WMH, white matter hyperintensities. (B) Linear regressions of AD biomarkers against gut microbiome–derived axes. Specifically, regressions of PET Aβ, PET tau, or cortical thickness (a measure of neurodegeneration) against PCoA sample coordinates derived from MetaPhlan3 taxonomic profiles (top and middle rows) or HUMAnN 3.0 functional pathway profiles (bottom row). Source PCoA ordinations are from Fig. 1B and fig. S3D. †P < 0.1, ANOVAs, Benjamini-Hochberg–adjusted. ANOVAs compare models regressing biomarker ~ PCoA axis*Aβ status against null models regressing biomarker ~ Aβ status to determine significantly improved explanation of variance with addition of the gut microbiome summary feature (PCoA axis). Regression models and ANOVAs are summarized in tables S6 to S8.