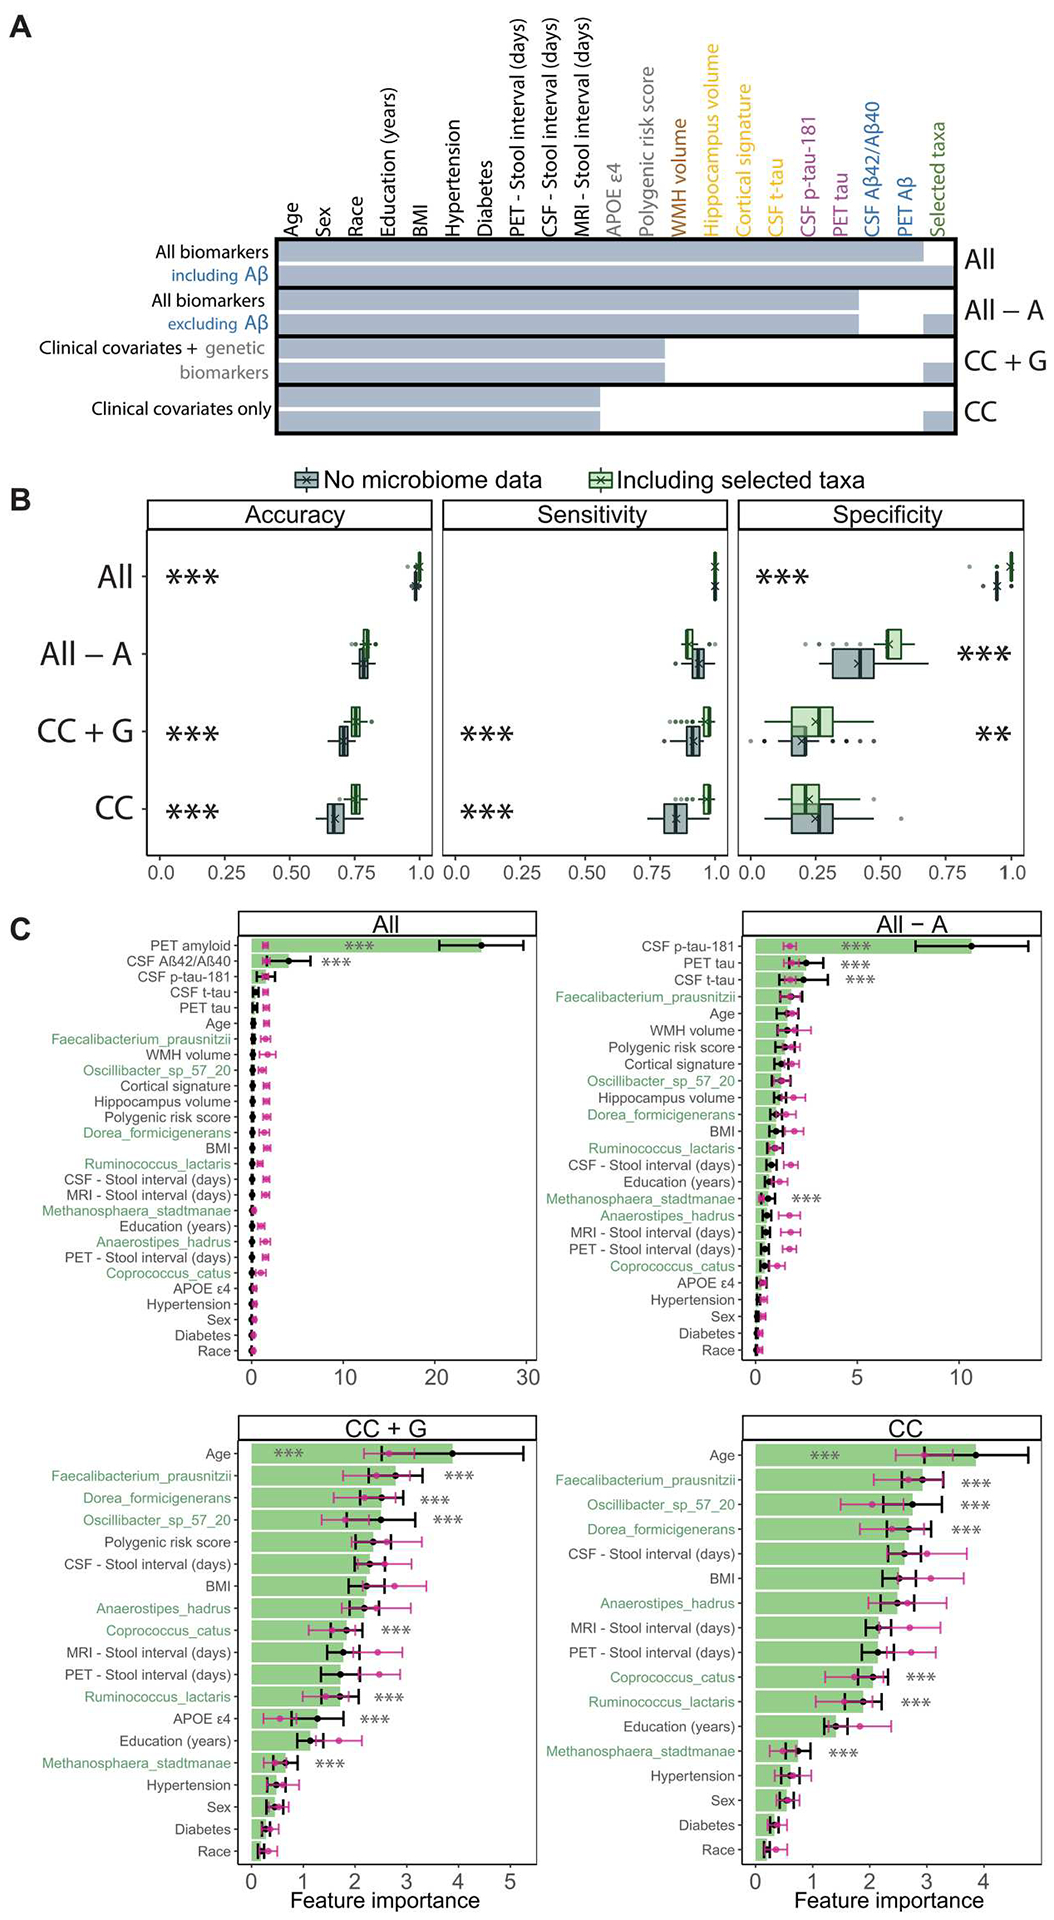
Fig. 4. Gut microbiome features improve the performance of Random Forest classifiers for AD status.

We compare the performance of Random Forest classification models with and without gut microbiome features, across combinations of AT(N) biomarkers and genetic risk factors for AD. (A) Summary of features included in each of the Random Forest models reported in (B) and (C). Feature inclusion is denoted by shaded cells. Models that include or exclude feature-selected gut taxa are compared (bottom and top of each model). Feature labels are colored by data/biomarker type (green, gut taxa; blue, Aβ; purple, tau; orange, neurodegeneration; brown, vascular injury; gray, genetic risk factors; black, clinical covariates). Except for model “All biomarkers including Aβ,” other models exclude Aβ biomarkers (PET Aβ and CSF Aβ42/Aβ40 ratio). Model shorthand names listed in the right margin: CC, clinical covariates; A, Aβ; G, genetics. Missing data were imputed before model training and are summarized in fig. S5. The feature with the most missingness was PET tau (20.7%). BMI, body mass index; WMH, white matter hyperintensities. (B) Performance metrics for Random Forest models that include or exclude feature-selected gut microbiome taxa (gray, no microbiome features; green, including relative abundances of feature-selected taxa). Boxplots summarize performance metrics on the retained validation cohort of models trained on 100 random partitions of the training cohort. Means are denoted by “X” in the boxplots. **P < 0.01 and ***P < 0.001. ANOVAs with Tukey’s post hoc test, Bonferroni-adjusted for multiple comparisons at both ANOVA and Tukey post hoc levels. (C) Importance of the features included in each model, averaged over the 100 training partitions (black), optionally with random class label shuffling at each iteration to generate null distributions (pink). Error bars represent SD. The seven taxonomic features are highlighted in green. ***P < 0.001. Student’s t test with Benjamini-Hochberg adjustment (see Table 2 and figs. S5 and S6).
