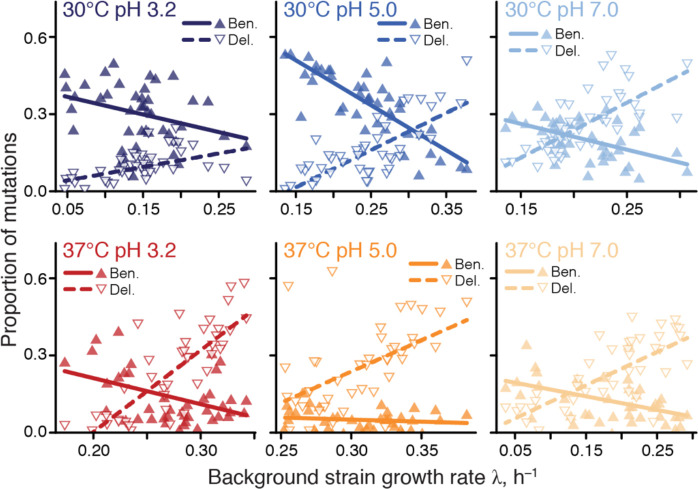
Figure 1. Proportions of beneficial and deleterious mutations vary with strain growth rate.
Filled and empty triangles show the proportions of beneficial and deleterious mutations in each background strain as a function of its growth rate. Lines are the best-fit linear regressions; all are statistically significant (P < 0.05, t-test) except for beneficial mutations in 37°C pH 5.0.

