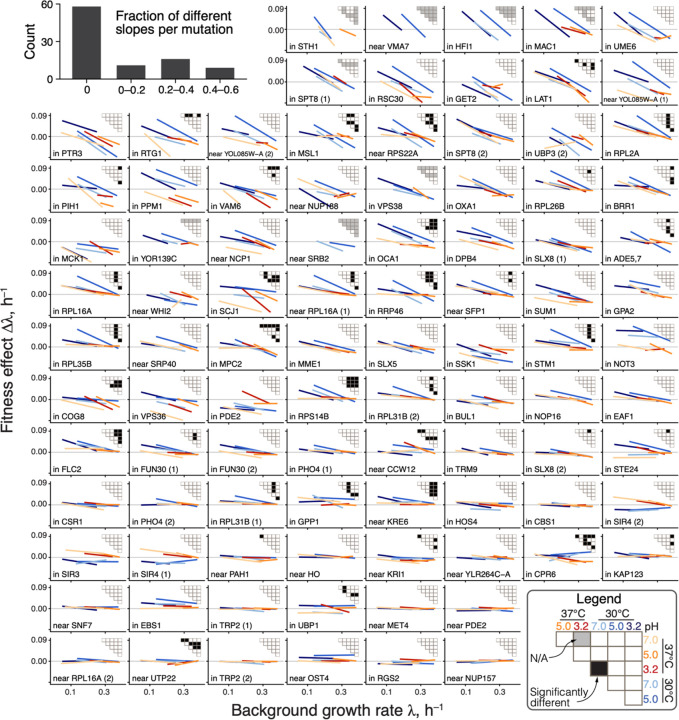
Figure 3. Global-epistasis slopes of mutations are nearly invariant across environments.
Panels show regression lines from fitting equation (1) for each mutation, colored by the environment as in previous figures. Data points are shown in Figure S6. Mutations are displayed in the order of increasing mean slope. Insets show the results of all pairwise slope-comparison tests (legend in lower right). Histogram in top left shows the overall distribution of fractions of significant tests per mutation (see (45), Section 1.3.7).

