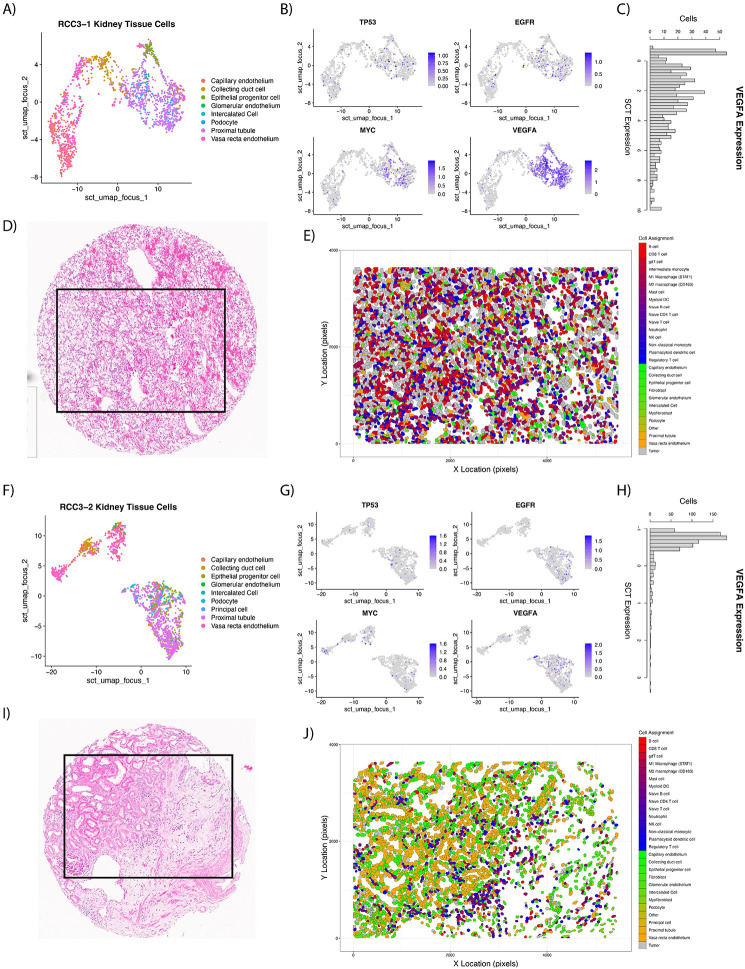
Figure 2:
Examples of FOVs used for malignant cell identification with LASSO generalized linear models. UMAPs were created of kidney tissue specific cells (non-immune, non-fibroblast) for a tumor (A) and stroma (F) FOV. Gene expression was plotted over the UMAP for TP53, EGFR, MYC, and VEGFA with ‘FeaturePlot’ to aid in identifying malignant cells (B and G). VEGFA showed high expression in malignant proximal tubule cells (C) while expression in normal proximal tubule cells (H) was low. H&E images (D and I) who cores sent for CosMx SMI. After ‘InSituType’ and malignant cell classification, polygon plots were constructed with final cell assignments (E and J).

