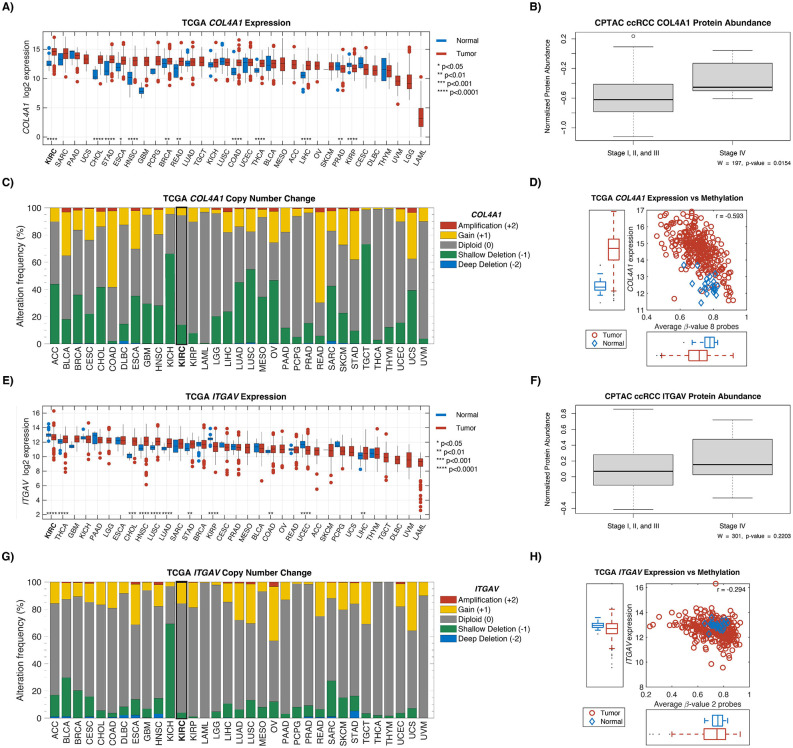
Figure 6:
Exploration of COL4A1 and ITGAV in TCGA and CPTAC. Gene expression in tumor and normal for COL4A1 (A) and ITGAV (E). Protein abundance between low stage ccRCC (I, II, and III) and high stage ccRCC (IV) for COL4A1 (B) and ITGAV (F). C) and G) show the copy number change associated with the two genes. TCGA gene expression against methylation levels are shown in D) and H).

