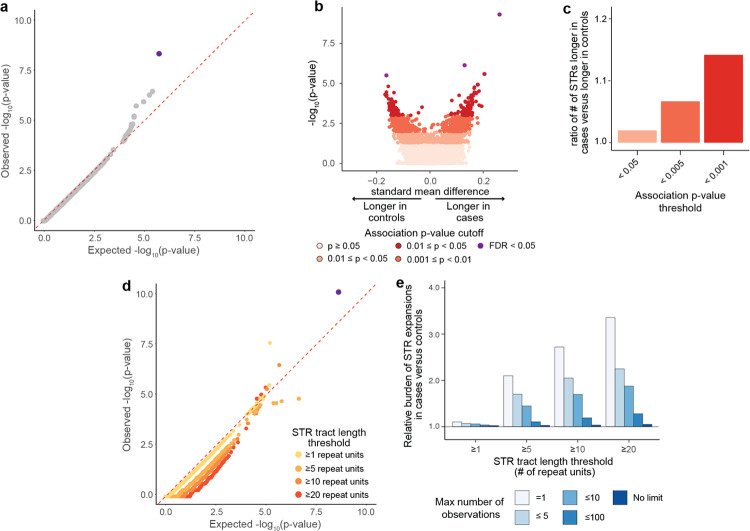
Figure 2: Statistical testing for single STR associations with AD risk.
a, Quantile-quantile plot of single STR association statistics. X-axis shows the expected distribution of −log10(p-values) under a uniform p-value distribution. Y-axis shows observed −log10(p-values). Each point represents a separate STR. b, Volcano plot for STR tract lengths under a single STR association test. Each point represents a single STR, with colors reflecting statistical significance of association. X-axis reflects standard mean difference, which is the difference in mean STR lengths between cases and controls divided by the standard deviation of STR lengths across the whole cohort. Positive values reflect longer mean STR tract lengths in cases as compared with controls. c, Ratio of number of STRs with tract lengths that are longer in cases relative to the number of STRs with tract lengths longer in controls at different statistical significance thresholds. d, Quantile-quantile plot of p-values hypergeometric test comparing number of STR expansions in cases versus controls for each STR. X-axis shows the expected distribution of −log10(p-values) under a uniform p-value distribution. Y-axis shows observed −log10(p-values). Each point represents a separate STR, and points are colored by the STR tract length threshold. e, Relative burden of STR expansions in case versus control individuals at different STR tract length and frequency thresholds. Values above 1.0 reflect higher burden of expansions observed in cases than controls.

