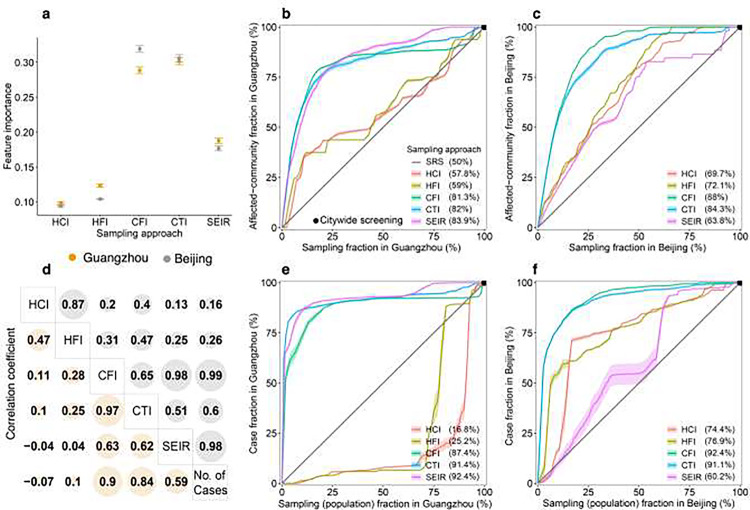
Fig. 4. Performance of mobility-based spatial sampling approaches in detecting COVID-19 affected communities and cases at varying sample sizes.
Four mobility-based spatial sampling approaches (HCI - human contact intensity; HFI - human flow intensity; CFI - case flow intensity; CTI - case transmission intensity) and an epidemiological model (SEIR) were evaluated. a. The relative importance of infection risk () in distinguishing communities with COVID-19 cases from those without, determined by a random forest built-in feature importance measure. Error bars indicate 95% confidence intervals. d. Pearson correlation coefficients between infection risk estimated from each sampling method and the number of confirmed cases during the outbreaks. For panels b-c and e-f, communities with high infection risk were sampled by ranking community-level 𝜌𝑖 from high to low, excluding the simple random sampling (SRS) method. The x-axis in b and c represents the proportion of sampled communities over the total number of communities in Guangzhou and Beijing, respectively. In e and f, the x-axis denotes the fraction of sampled populations among the total populations. The y-axis in b and c represents the proportion of affected communities sampled over the total communities with COVID-19 cases in Guangzhou and Beijing. In e and f, the y-axis displays the proportion of cases detected by different sampling approaches among the total cases. The percentage in the legend indicates the area under each curve, reflecting the average performance of each sampling approach with different sample sizes. The black dot at the upper right corner of each panel represents citywide screening for the entire population, assuming the test can detect all infected people in the city. Shaded regions denote 95% confidence intervals.

