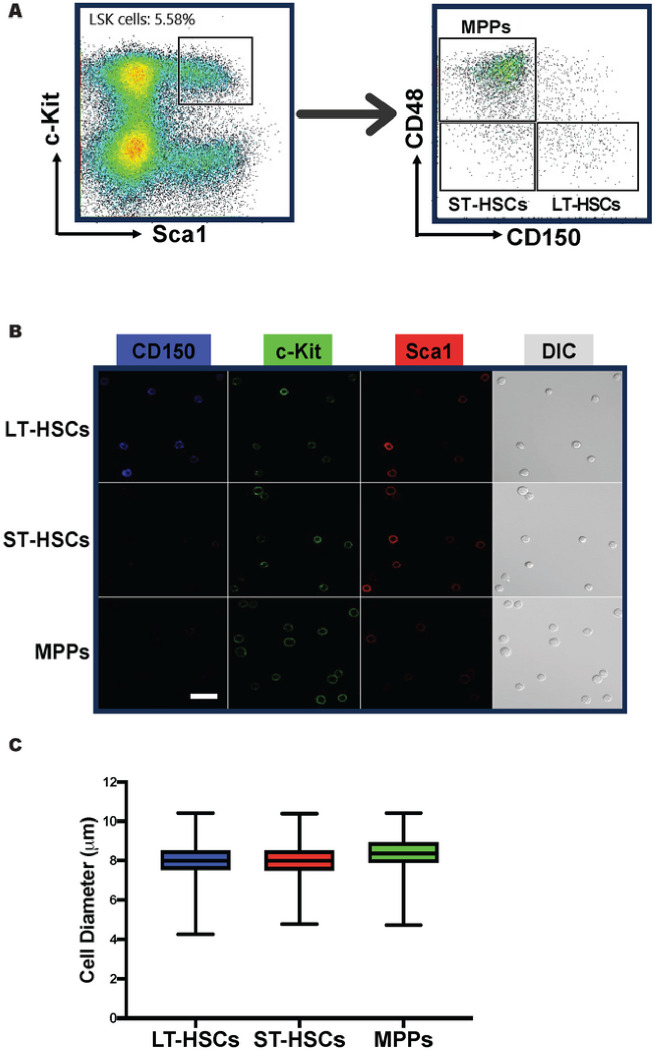
Figure 2. LT-HSCs, ST-HSCs, and MPPs do not exhibit significant difference in size.
(A) Representative FACS density dot plots show the gating strategy employed to identify and isolate LT-HSCs, ST-HSCs, and MPPs from murine BM. (B) DIC and fluorescence images were taken immediately after FACS. Typical images are shown. Scale bar = 10 μm. (C) The box plot depicting the cell diameter dispersion of LT-HSCs, ST-HSCs, and MPPs. The boxes represent the middle 50% (interquartile range, IQR) of cells and the solid lines inside the boxes are the medians. The upper and lower whiskers indicate the cells that are outside the middle 50% range, and they are calculated as ± 1.5 × IQR. Outliers are not shown.

