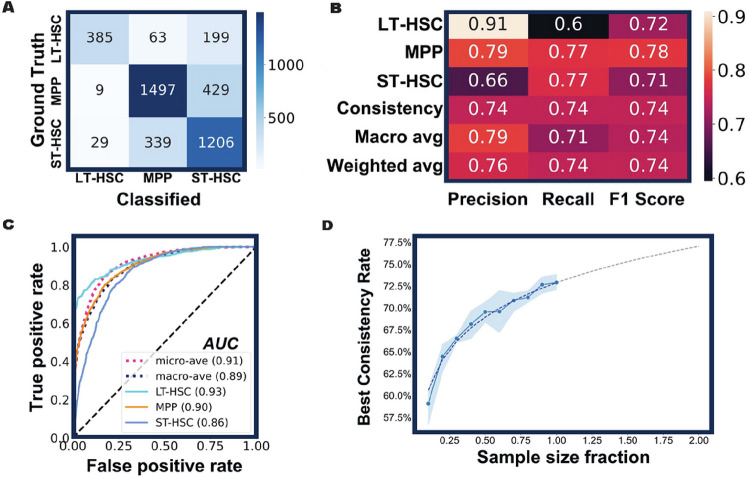
Figure 3. The LSM model’s performance in predicting distinct hematopoietic precursor subpopulations.
(A) The confusion matrix of the LSM model. After the training and validation process, new cells from three HSPC subsets were classified by the model and the results are summarized. (B) The performance metrics of the model. (C) The ROC-AUC curve of the model. All AUC values are above 0.85, indicative of a good performance of the model. Diagonal dashed line represents a random classifier with no discrimination. (D) The performance of the LSM model is correlated with the training sample size. With increased sample sizes (from 10% to 100% of total training data), the overall consistency rate of the model improved accordingly. For each sample size, five iterations of training were executed with 20 epochs. The mean of the overall consistency rate (blue dots) and the corresponding 95% confidence interval (blue shade) are shown. The dashed line is a fitted curve with extrapolation.

