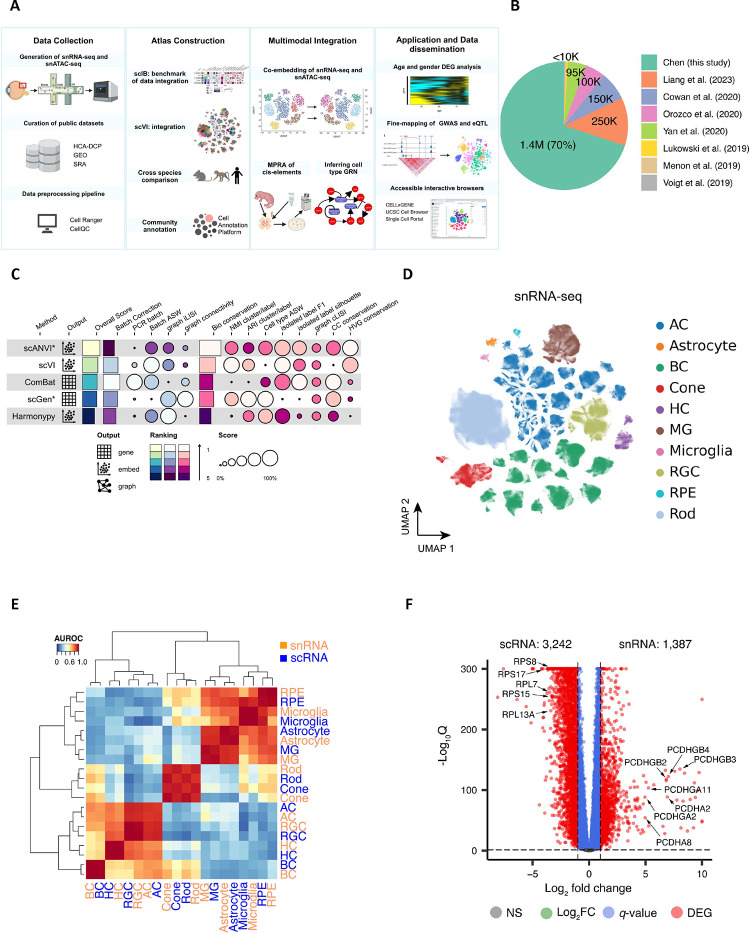
Figure 1. Overview of single cell atlas of the human retina.
A. The integrated study for the atlas involves compiling public datasets and in-house generated data, integrating datasets, annotating cell clusters, utilizing chromatin profiles for multi-omics, and demonstrating the utility by applications. B. Collected retinal datasets comprising of both in-house newly generated and seven publicly available datasets. C. Five data integration algorithms are benchmarked for data harmonization. The algorithms are evaluated using 14 metrics, with the rows representing the algorithms and columns corresponding to the metrics. The algorithms are ranked based on their overall score. D. The atlas of snRNA-seq datasets is visualized in a UMAP plot at a major class resolution, with cells colored based on their major classes. E. Cell type similarities of major classes between snRNA-seq (in coral) and scRNA-seq (in blue). The color key is the average AUROC of self-projection for cell types. F. Volcano plot of genes over-expressed in snRNA-seq datasets (on the right) and scRNA-seq (on the left). The x-axis is log2 fold change, and the y-axis is −log10 q-value. Differentially expressed genes were identified under |log2 fold change|>1 and q-value<0.05 and are depicted as red dots. Selected gene symbols point to the DEGs, including seven genes encoding protocadherin proteins on the right: PCDHGB2, PCDHGB3, PCDHGB4, PCDHGA2, PCDHA2, PCDHGA11, PCDHA8; and five genes encoding ribosomal proteins on the left: RPL7, RPL13A, RPS8, RPS15, RPS17.

