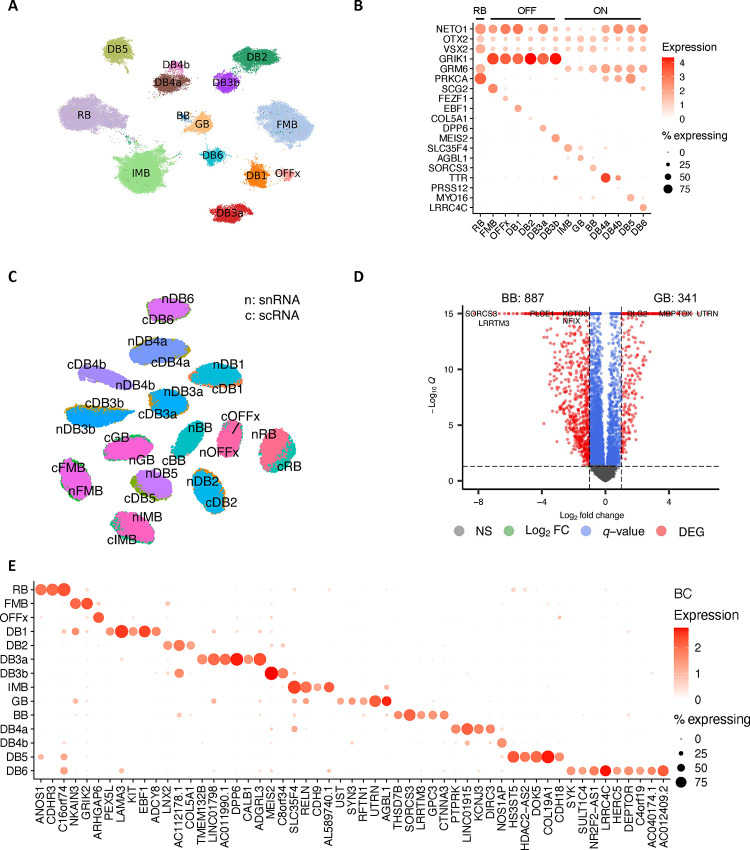
Extended Data Figure 3. transcriptomic signature of bipolar cells.
A. UMAP visualization of BC cells based on single-cell transcriptome data. B. Dot plot of the distribution of marker gene expression by the single-cell measurements. C. Co-embedding between snRNA-seq and scRNA-seq cells. The label names are prefixed by “n” for snRNA and “c” for scRNA. D. Volcano plot of differentially expressed genes between GB and BB of the snRNA-seq datasets. Differentially expressed genes were identified under |log2 fold change|>1 and q-value<0.05. E. Predicted markers per BC cell type by the binary classification analysis using snRNA-seq datasets. Rows are BC cell types, and columns represent novel markers.

