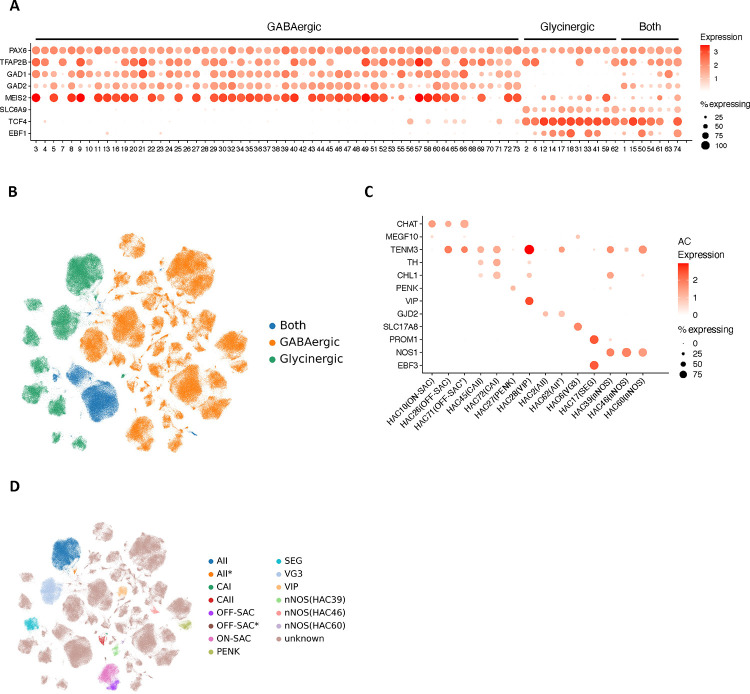
Extended Data Figure 4. Annotation of amacrine cells.
A. Dot plot of AC cell clusters by markers to identify AC subclasses for GABAergic, Glycinergic, and Both. PAX6 and TFAP2B were used as AC pan-markers. GAD1/GAD2 were used for GABAergic ACs, and SLC6A9 was used for the Glycinergic ACs. MEIS2, TCF4, and EBF1 were also included in the dot plot. B. UMAP of AC cells, colored by the four AC groups. C. Dot plot of 14 AC cell clusters with known markers. The cell type names are indicated in parentheses next to the cluster IDs. D. UMAP visualization of AC cells, colored by the 14 clusters with cell type names. The rest of the clusters are colored as “unknown” without existing names.

