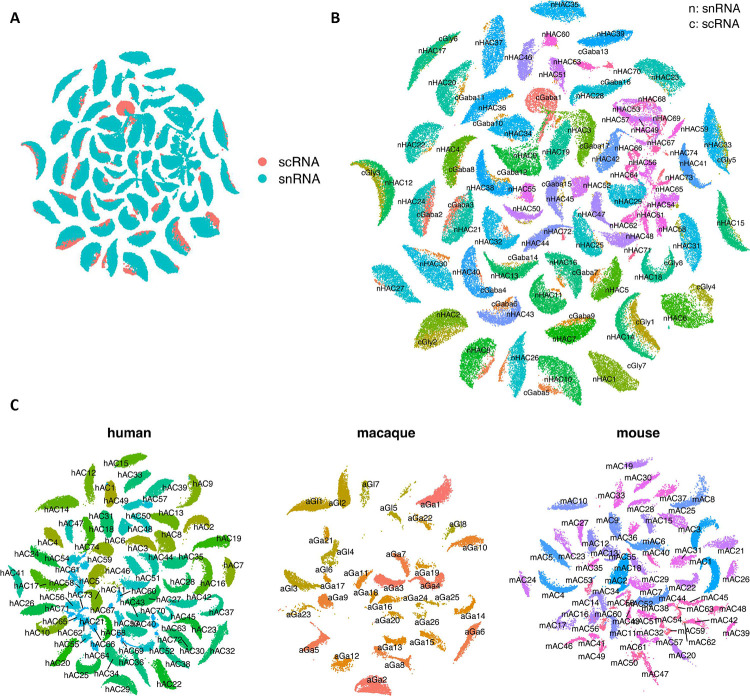
Extended Data Figure 5. Cross-mapping for human amacrine cells.
A. SATURN co-embedding visualization of AC cell types between snRNA-seq and scRNA-seq. AC cells are colored by the two technologies. B. The same SATURN co-embedding with AC type labels color-coded on top of clusters. Labels are prefixed with “n” for snRNA-seq datasets and “c” for scRNA-seq data. C. SATURN co-embedding visualization of AC types across human, macaque and mouse species. AC cell labels for the three species are overlaid on clusters. Labels are prefixed with “h” for human, “a” for macaque, and “m” for mouse.

