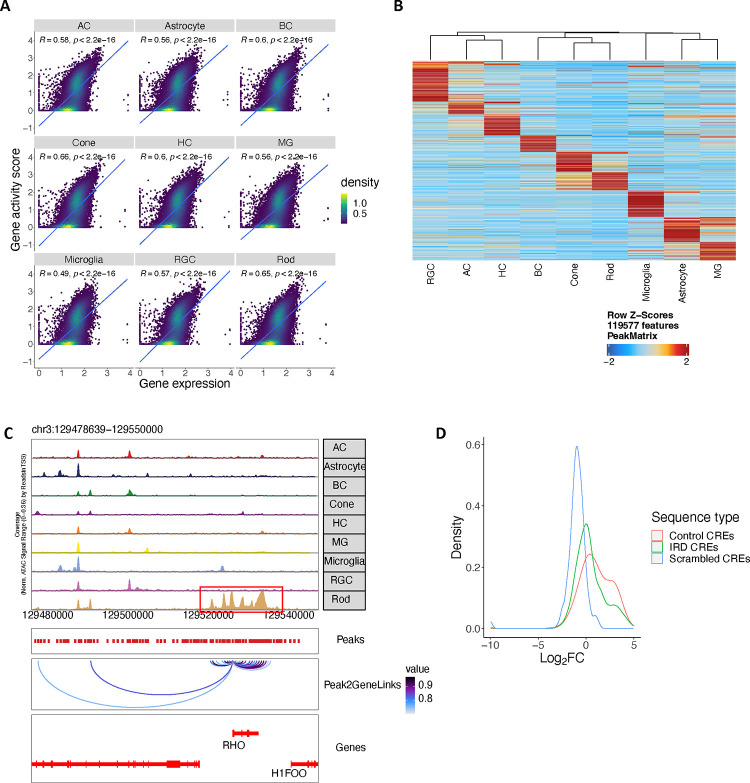
Extended Data Figure 7. A high resolution snATAC-seq cell atlas of the human retina.
A. Scatter plot showing the correlation between gene expression derived from snRNA-seq (X axis) and gene activity score derived from snATAC-seq (Y axis) from major retinal cell classes. B. Heatmap showing the chromatin accessibility of differential accessible regions (DARs) identified in major retinal cell classes. Rows represented chromatin regions specific to certain major classes, and columns corresponded to major classes. C. Genome track of the RHO locus showing the cell type specific chromatin accessibility in the promoter and linked cis-regulatory elements of this gene. D. Density plot showing the activity (log2FC value of comparison between activity of each tested sequence and the activity of a basal CRX promoter) distribution of the tested sequences by MPRAs. IRD CREs n=1,820 (green), control CREs with a variety of activities n=20 (red), Scrambled CREs n=300 (blue).

