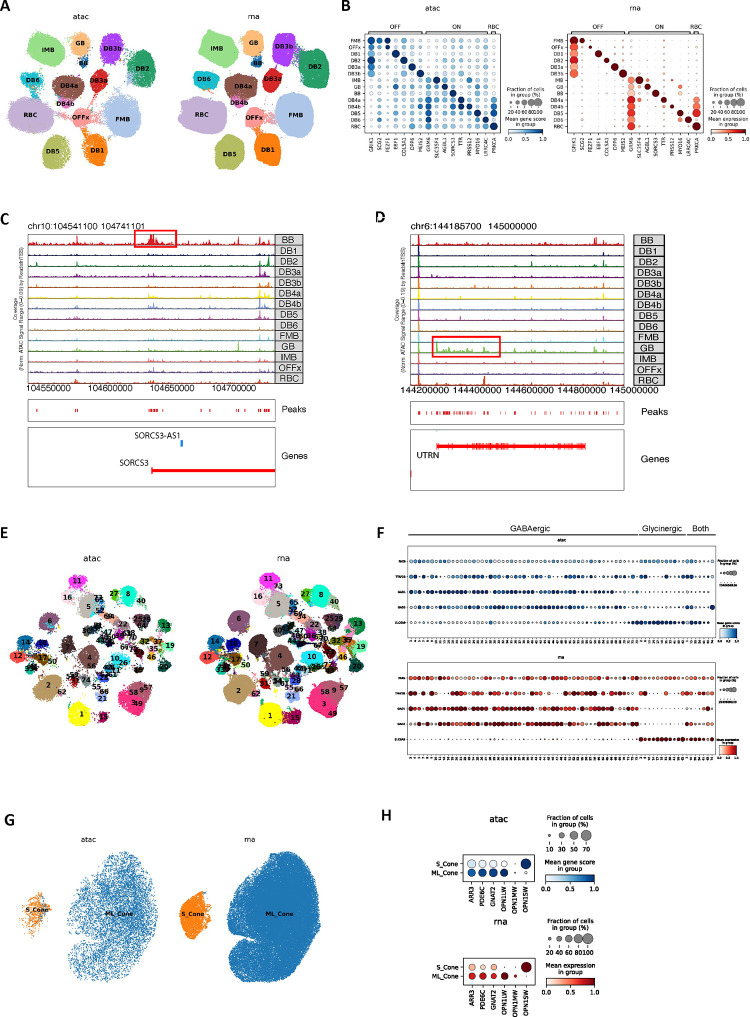
Extended Data Figure 8. Multi-omics atlas of the human retinal subclass cell types.
A. UMAP showing the co-embedding of bipolar cells (BC) from snRNA-seq and snATAC-seq were clustered into BC cell types. B. Dot plot showing marker gene expression measured by snRNA-seq and marker gene activity score derived from snATAC-seq are specific in the corresponding BC cell types. C. Genome track of SORCS3 showing the promoter of SORCS3 is specifically open in BB. D. Genome track of UTRN showing the local chromatin of UTRN is specifically open in GB. E. UMAP showing the co-embedding of amacrine cells (AC) from snRNA-seq and snATAC-seq were clustered into AC cell types. F. Dot plot showing marker gene expression measured by snRNA-seq and marker gene activity score derived from snATAC-seq are specific in the corresponding sub classes of AC types. G. UMAP showing the co-embedding of cone cells (Cone) from snRNA-seq and snATAC-seq were clustered in Cone cell types. H. Dot plot showing marker gene expression measured by snRNA-seq and marker gene activity score derived from snATAC-seq are specific in the corresponding Cone cell types.

