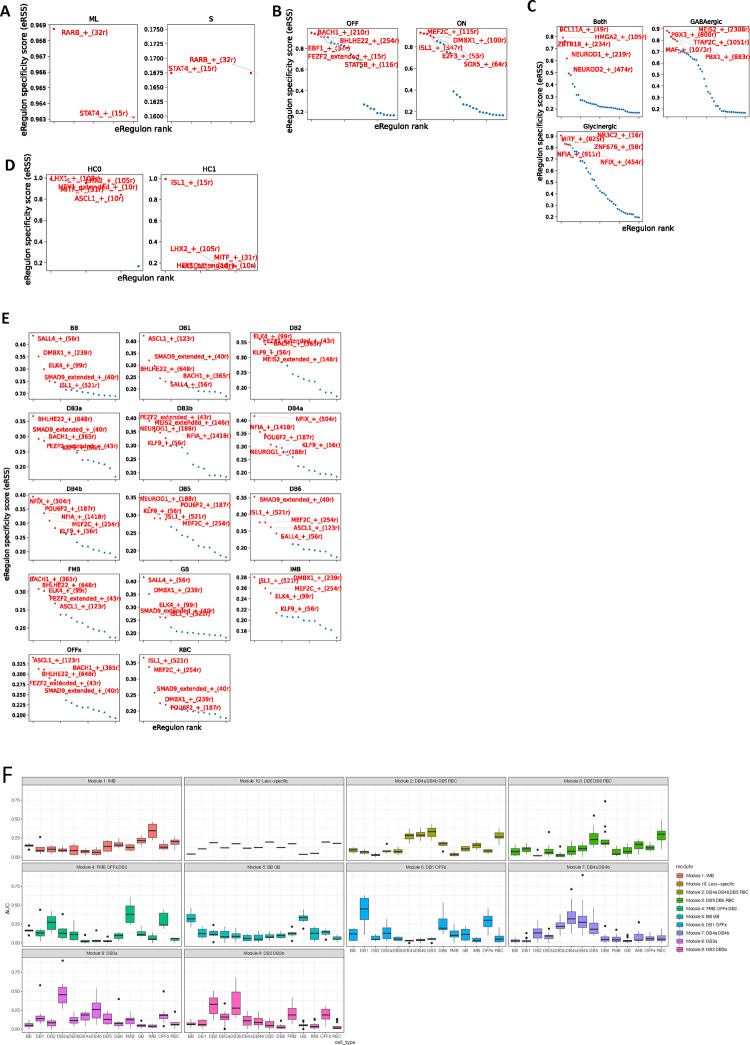
Extended Data Figure 9. Regulon of the human retinal subclass cell types.
A. Dot plot showing the distribution of regulon specificity score of regulons identified in ML- and S-Cone. B. Dot plot showing the distribution of regulon specificity score of regulons identified in OFF- and ON-BC (ON-BC include ON-Cone BC and Rod BC). C. Dot plot showing the distribution of regulon specificity score of regulons identified in GABAergic-, Glycinergic- and Both-AC. D. Dot plot showing the distribution of regulon specificity score of regulons identified in HC0 and HC1. E. Dot plot showing the distribution of regulon specificity score of regulons identified in 14 BC cell types. F. Boxplot showing the average AUC values of the regulon modules identified in BC cell types. The BC cell types with the highest AUC values were labeled in the title of each regulon module.

