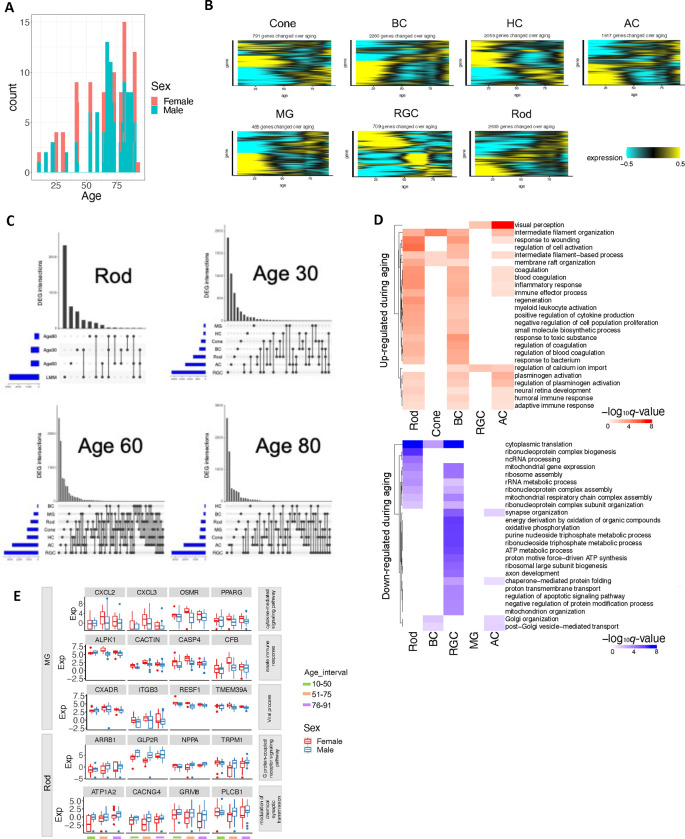
Extended Data Figure 10. Differential gene expression during aging and associated with sex.
A. Age and sex distribution of the analyzed samples. B. Heatmap showing gene expression level of differentially expressed genes (DEGs) during aging in major retinal cell classes identified with linear mixed effect model (LMM). C. UpSet plot showing the overlap of DEGs identified by LMM and sliding-window analysis at the age of 30, 60 and 80 in Rod. UpSet plot showing the number of DEGs across major retinal cell classes at the age of 30, 60 and 80, respectively. D. The GO terms significantly enriched (FDR <0.1) of DEGs during aging identified by LMM across retinal cell classes. E. The examples of DEGs between male and female associated with the enriched GO terms.

