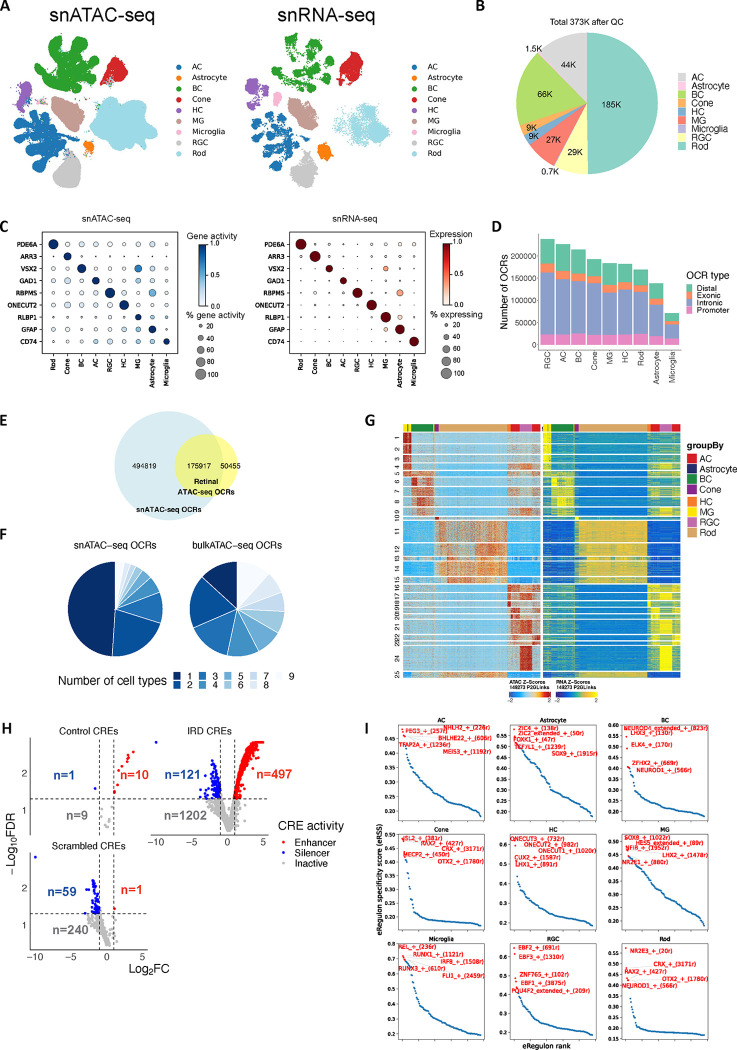
Figure 4. A high resolution snATAC-seq cell atlas of the human retina.
A. Uniform Manifold Approximation and Projection (UMAP) of co-embedded cells from snRNA-seq and snATAC-seq showing cells are clustered into major retinal cell classes. B. Pie chart showing the cell proportion distribution of major retinal cell classes in this study. C. Dot plot showing marker gene expression measured by snRNA-seq and marker gene activity score derived from snATAC-seq are specific in the corresponding cell class. D. Bar plot showing the number of open chromatin regions (OCRs) identified in each major cell class. E. The Venn Diagram showing the overlapped OCRs detected by retinal snATAC-seq and bulk ATAC-seq. F. Pie chart showing cell type specificity of OCRs identified from retinal snATAC-seq (left) and bulk ATAC-seq (right). The color codes the number of cell types where the OCRs were observed. G. Heatmap showing chromatin accessibility (left) and gene expression (right) of 149,273 significantly linked CRE-gene pairs identified by the correlation between gene expression and OCR accessibility. Rows represented CRE-gene pairs grouped in clusters by correlations. H. Volcano plot showing the log2FC value (comparison between activity of each tested sequence and the activity of a basal CRX promoter, X axis) and the −log10FDR value (Y axis) of each tested sequence by MPRAs (IRD CREs n=1,820, control CREs with a variety of activities n=20, Scrambled CREs n=300). Each dot corresponds to a tested sequence, colored by the activity of the sequence. I. Scatter plot showing the eRegulon specificity score for each transcription factor (TF) and the corresponding regulon across major retinal cell classes. The top five TF and eRegulon are highlighted in red.

