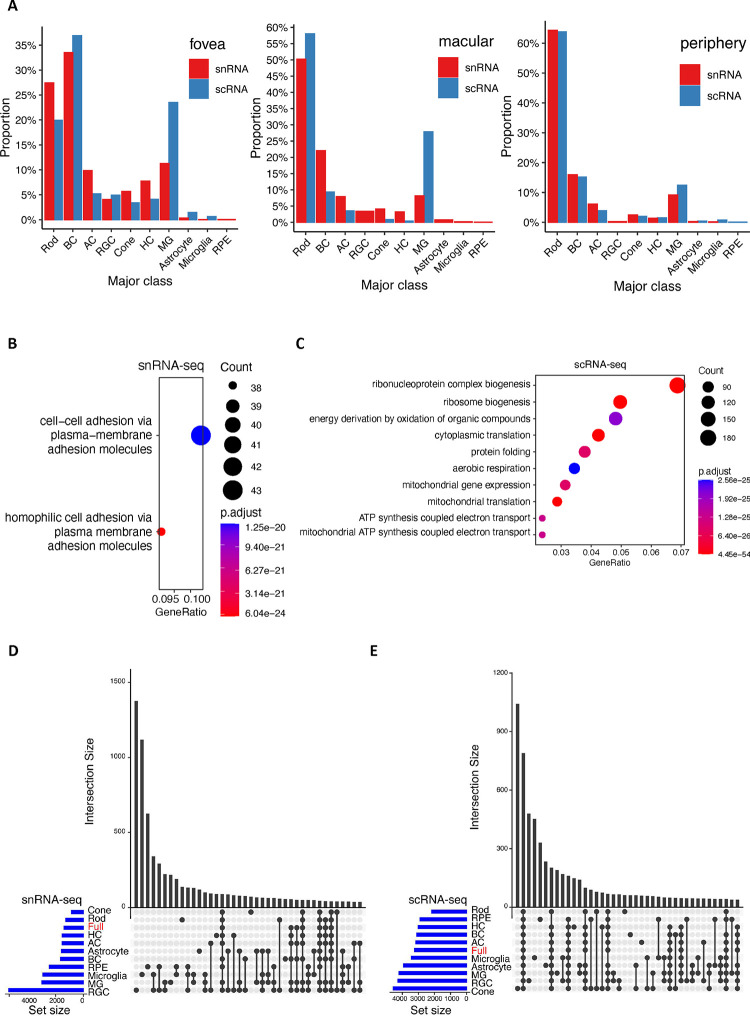
Extended Data Figure 2. Comparison between single-nuclei and single-cell technologies.
A. Cell proportion of major class of samples between snRNA-seq and scRNA-seq in fovea, macular, and periphery tissue regions. The red bar represents cell proportions of major classes in snRNA-seq samples, and the blue bar represents cell proportions of scRNA-seq samples. B. Enriched GO BPs of 1,387 over-expressed genes in snRNA-seq data. C. Enriched GO BPs of 3,242 over-expressed genes in scRNA-seq data. D. Shared genes over-expressed in snRNA-seq data among major cell classes. The ”Full” (in red) is genes over-expressed in snRNA-seq data regardless of cell classes. E. Shared of genes derived from scRNA-seq data.

