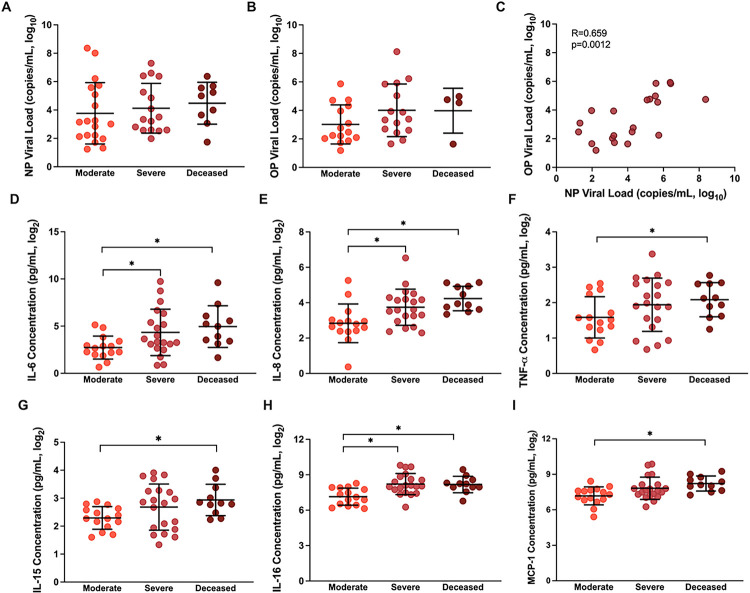
Figure 1. SARS-CoV-2 virus RNA and cytokine/chemokine responses among hospitalized COVID-19 patients at enrollment.
(A) Nasopharyngeal (NP) viral load (copies/mL, log10) and (B) oropharyngeal (OP) viral load (copies/mL, log10) were measured by qPCR at enrollment and compared among patients classified as moderate (WHO score 3–4), severe (WHO score 5–7), or deceased (WHO score 8). (C) The Spearman correlation between OP and NP viral loads at enrollment. (D-I) Concentrations (pg/ml) of several proinflammatory cytokines and chemokines that differed among COVID-19 hospitalized patients classified as moderate, severe, or deceased. Data are presented as means with standard deviations in black. Asterisk (*) indicates statistically significant differences (p<0.05) by Welch’s ANOVA.

