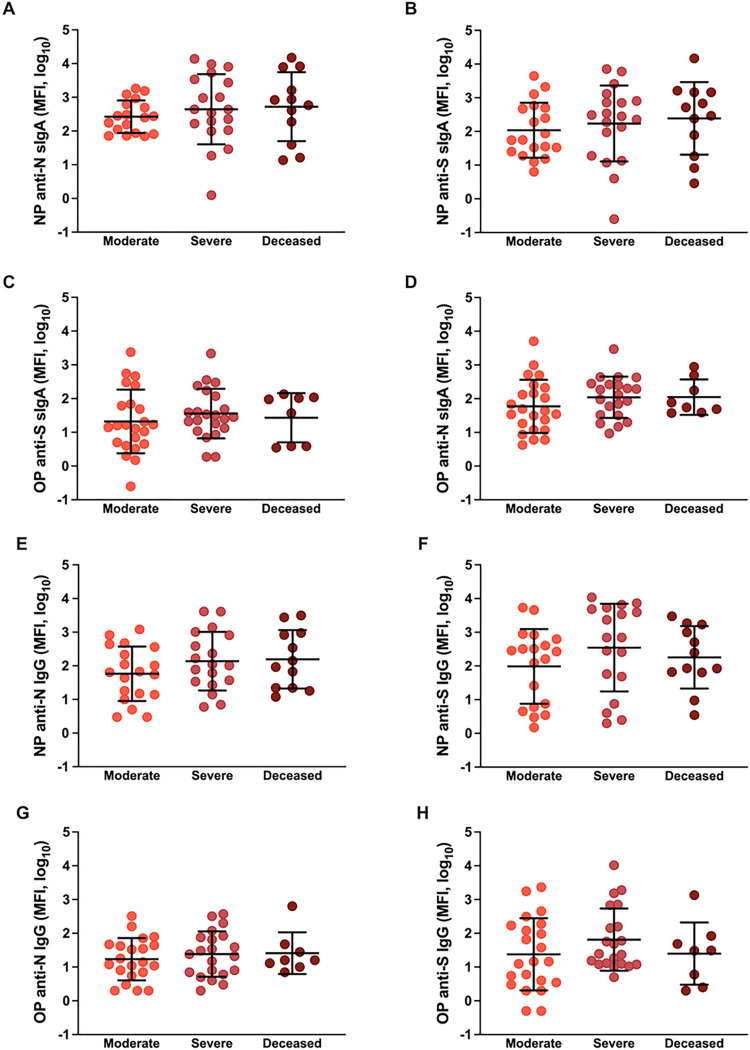
Figure 2. Mucosal antibody responses among hospitalized COVID-19 patients at enrollment.
(A-D) Anti-nucleocapsid (N) and anti-Spike (S) secretory IgA or (E-H) IgG responses were measured as median florescence intensity (MFI) in nasopharyngeal (NP) or oropharyngeal (OP) samples and compared among COVID-19 hospitalized patients classified as moderate (WHO score 3–4), severe (WHO score 5–7), or deceased (WHO score 8). Means with standard deviations are depicted in all figures and data were analyzed using Welch’s ANOVA.

