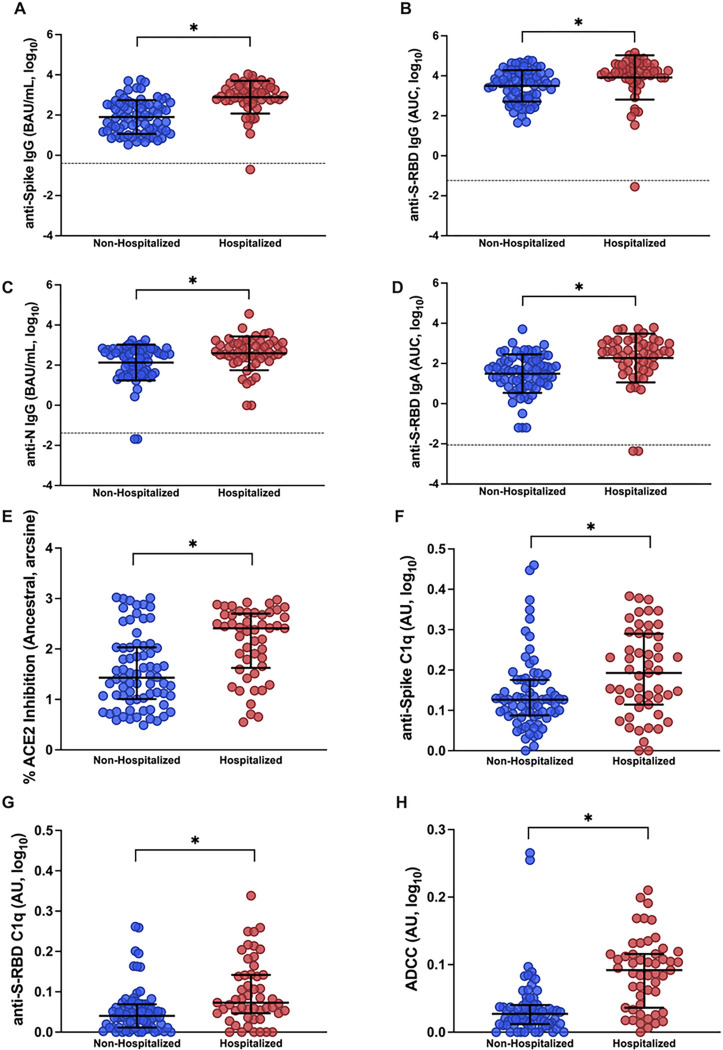
Figure 3. Antibody responses in plasma samples of non-hospitalized and hospitalized COVID-19 patients at 1-month post-enrollment (MPE).
(A-D) IgG binding antibody responses against ancestral spike (S), spike receptor binding domain (S-RBD), and nucleocapsid (N) were quantified by ELISA and calculated as the binding antibody units (BAU) per ml if international standards were available or as the area under the curve (AUC) if standards were not available and titration curves only could be generated; (E) ACE2 binding inhibition antibodies were measured using MSD V-PLEX SARS-CoV-2 ACE2 kits; and (F-H) Fc effector antibody responses were quantified using complement fixation and antibody-dependent cellular cytotoxicity (ADCC) assays. All assays were run using ancestral SARS-CoV-2. Data were compared using Welch’s t-test to look at differences between unvaccinated non-hospitalized and hospitalized patients at 1 MPE. Means with standard deviations are depicted in black. Limit of detection (LOD) are indicated by the dashed lines. Comparisons were performed using Welch’s t-tests. Asterisk (*) indicates statistically significant differences (p<0.05).

