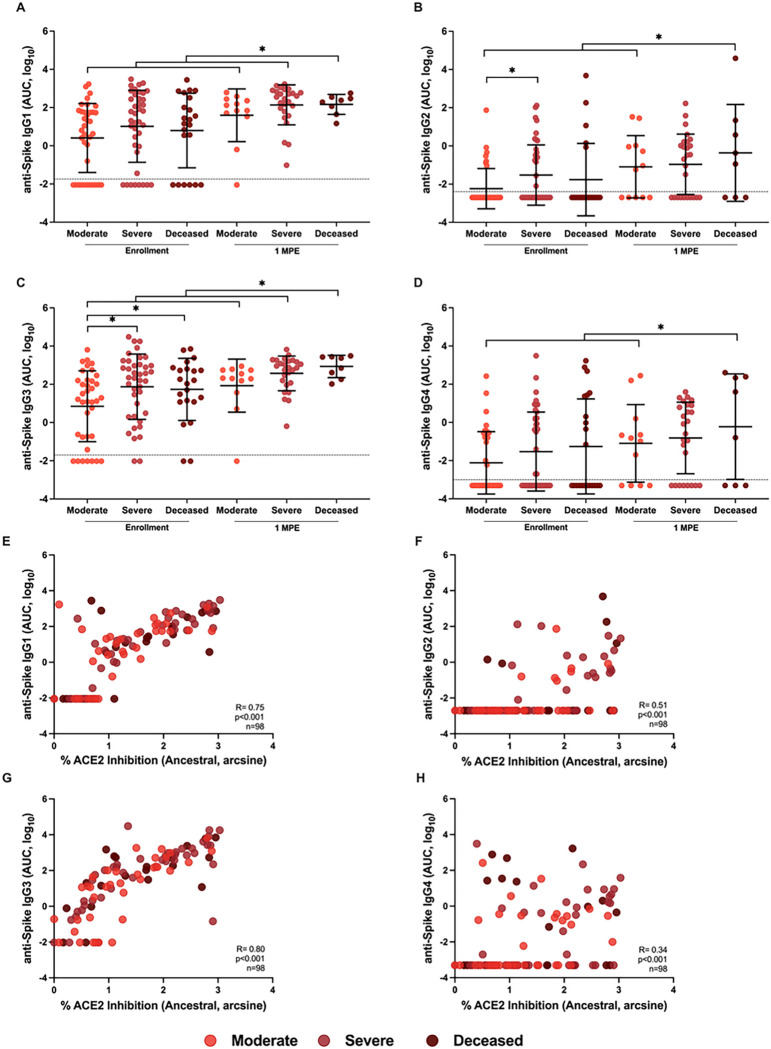
Figure 5. Analysis of anti-Spike (S) IgG subclasses (IgG1–4) among hospitalized COVID-19 patients at enrollment and 1-month post-enrollment (MPE).
The binding of IgG1 (A), IgG2 (B), IgG3 (D), and IgG4 (D) to ancestral SARS-CoV-2 S antigen were measured as the area under the curve (AUC). Spearman correlation of IgG1 (E), IgG2 (F), IgG3 (G), and IgG4 (H) with % ACE2 inhibition at enrollment. Hospitalized COVID-19 patients were classified as moderate (WHO score 3–4), severe (WHO score 5–7), or deceased (WHO score 8). Data are presented as means with standard deviations in black. Limit of detection (LOD) are indicated by the dashed lines. Asterisk (*) indicates statistically significant differences (p<0.05) by linear mixed-effects regression to compare change over time or Welch’s ANOVA.

