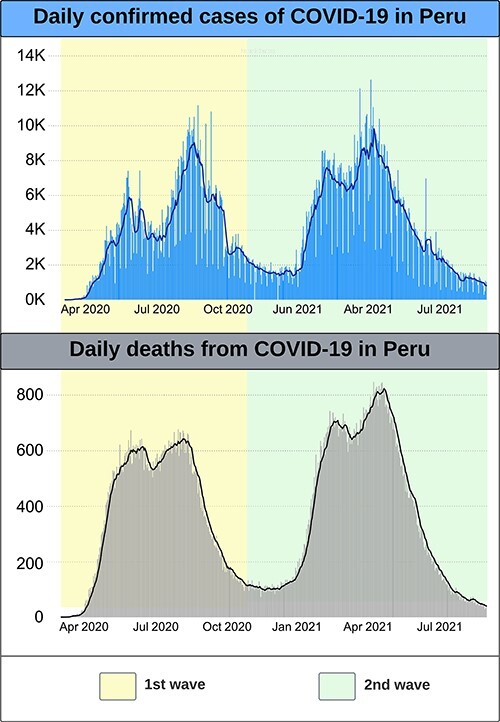
Figure 4.

Epidemiological graphics of daily COVID-19 cases and deaths in Peru during the study period (March 2020–August 2021), provided by the co-author Cecilia Anza-Ramirez. Source: Peruvian Ministry of Health

Epidemiological graphics of daily COVID-19 cases and deaths in Peru during the study period (March 2020–August 2021), provided by the co-author Cecilia Anza-Ramirez. Source: Peruvian Ministry of Health