Figure 3.

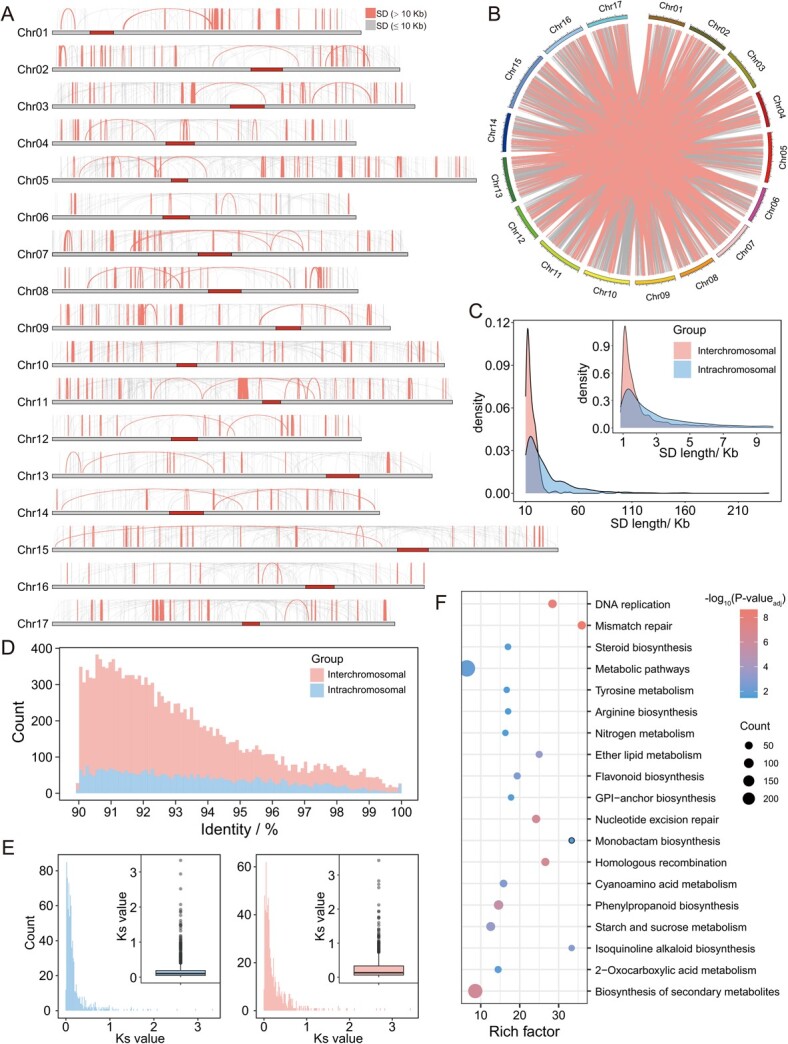
Segmental duplication (SD) analysis in the YH1 genome. (A) Distribution of intrachromosomal segmental duplication. (B) Distribution of interchromosomal segmental duplication. . (C) Density plot of SD length distribution. (D) Histogram comparing sequence identity of interchromosomal SDs and intrachromosomal SDs. (E) Histogram and boxplot showing the Ks value distribution of genes in intrachromosomal (left) and interchromosomal SDs (right). (F) KEGG enrichment results of genes in SD regions (adjusted P-value <0.05).
