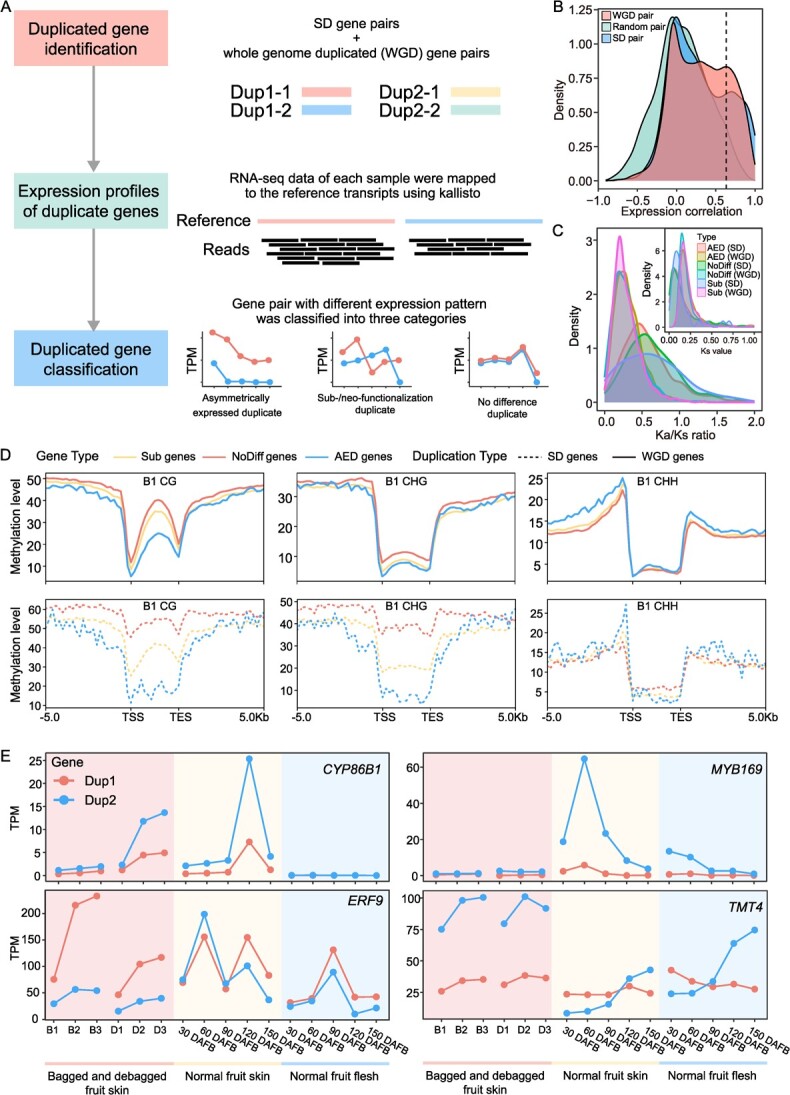
Figure 4.

Analysis of pear gene duplication and divergence. (A) Distribution of asymmetrically expressed duplicate (AED), sub-/neo-functionalization (Sub), and no difference (NoDiff) gene pairs. Detailed information can be found in the Materials and methods section. (B) Density plots of the Pearson correlation coefficient between gene pairs in instances of segmental duplication (SD), whole genome duplication (WGD), and random gene pairs (see below). All duplicated gene pairs identified from Whole-Genome Duplication Integrated analysis (WGDI) were classified as WGD gene pairs. 10 000 gene pairs were randomly selected using the ‘random’ module in Python. (C) Distribution of Ks and Ka/Ks ratio of AED, Sub, and NoDifff gene pairs in SD and WGD gene pairs. (D) CG, CHG, and CHH methylation level of AED, Sub, and NoDiff genes in the bagged fruit skins (B1) sample. Dotted lines represent SD genes and continuous lines represent WGD genes. (E) Expression pattern of four duplicated gene pairs (CYP86B1, MYB169, ERF9, and TMT4) in different fruit samples. Dup1 and Dup2 represent the two duplicated genes. D1, D2, and D3 represent debagged fruit skins at 4, 8, and 10 days after bag removal, respectively; B1, B2, and B3 represent bagged fruit skins at 4, 8, and 10 days after bagging, respectively; 30, 60, 90, 120, and 150 DAFB represent fruit at the specified number of days after flower bloom
