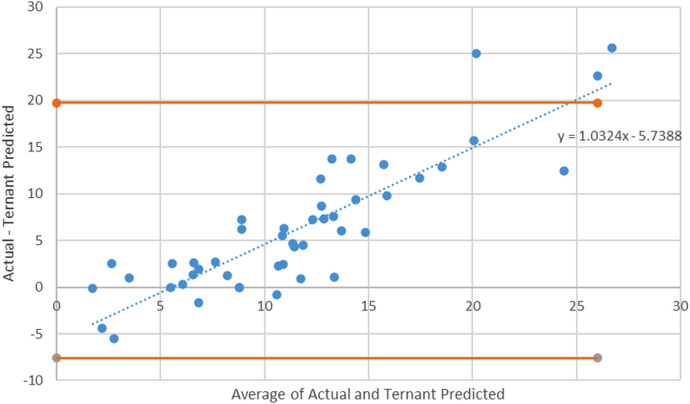
Figure 3.
Ternant method Bland-Altman plot with 95% CI limits. The Bland-Altman plot for the Ternant method shows a slope and constant that are significant (p < 0.001), suggesting that the Ternant method has the potential to show an initial overprediction at lower values and an underprediction at larger values.

