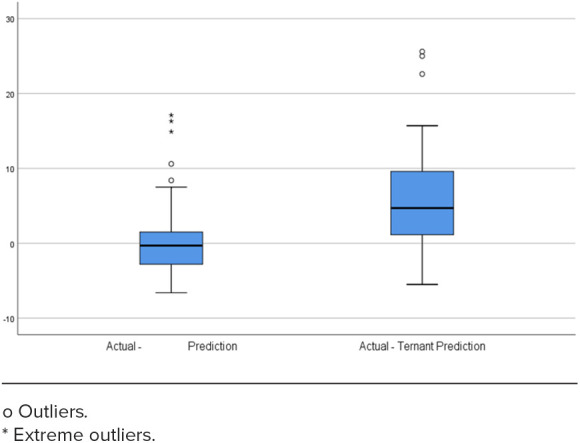
Figure 5.

Box plots comparing the distribution of the de Klaver and Ternant predictions. After plotting the difference between actual and predicted serum trough concentrations, the 2 methods were compared to determine the degree of variability in their predictions. The Ternant method demonstrated a larger distribution than the De Klaver—Berend method, showing greater variability in the difference between actual and predicted serum trough concentrations.
