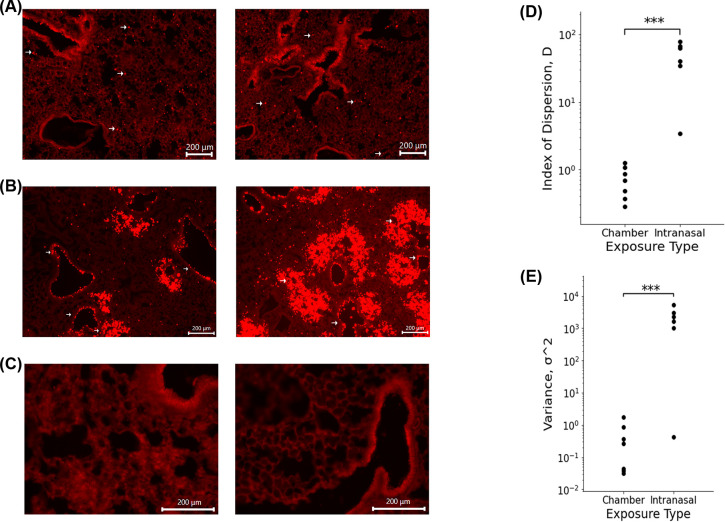
Fig 3.
(A) Fluorescence images of microsphere deposition of WT mouse exposed to 1μm fluorescent microspheres via exposure chamber. Arrows highlight microspheres. (B) Fluorescence images of microsphere deposition of WT mouse exposed to 1μm fluorescent microspheres intranasally. Arrows highlight preferential clustering of microspheres around medium sized airways. (C) Fluorescence images of control WT mouse lung. (D) Index of Dispersion of chamber and intranasally exposed WT mice. P value = 0.036581 I Raw variance of chamber and intranasally exposed WT mice. p value = 0.01363.

