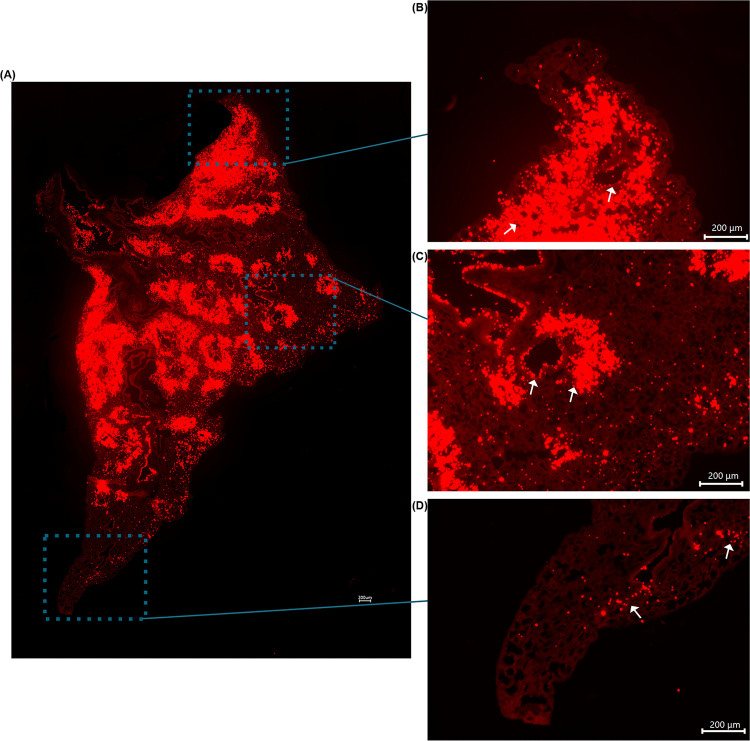
Fig 4.
(A) Tile stitched fluorescence image of intranasally exposed WT mouse lung illustrating nonuniform microsphere distribution throughout entire left lung lobe. (B) Enlarged image of figure (A) to highlight nonuniform deposition at apex of lung. (C) Enlarged image of figure (A) to illustrate nonuniform deposition in middle area of lung. (D) Enlarged image of figure (A) to demonstrate nonuniform deposition in distal portion of lung. Arrows highlight microsphere clustering surrounding airways.

