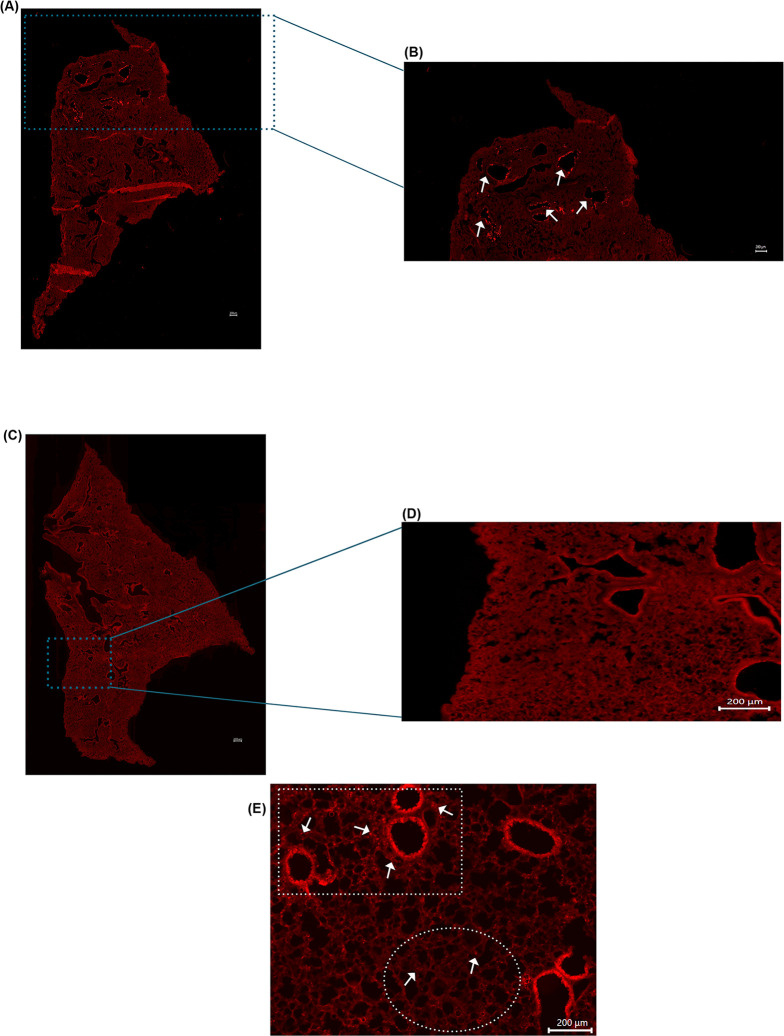
Fig 6.
(A) Tile stitched fluorescence image of full left lobe of intranasally exposed WT mouse illustrating microsphere deposition at apex of the lung only. (B) Enlarged image of figure (A) to highlight deposition in apex of lung. Arrows highlight clustering of microspheres around airways. (C) Representative tile stitched fluorescence image of full left lobe of control WT mouse exposed to PBS intranasally (D) Enlarged image of figure (C). (E) Fluorescence image of PGRP+ mouse intranasally exposed to LPS illustrating preferential clustering around airways. White square highlights neutrophil clustering surrounding airways. White circle highlights minimal neutrophil deposition in parenchyma of lung. Arrows highlight PGRP+ cells recruited into the lung.

