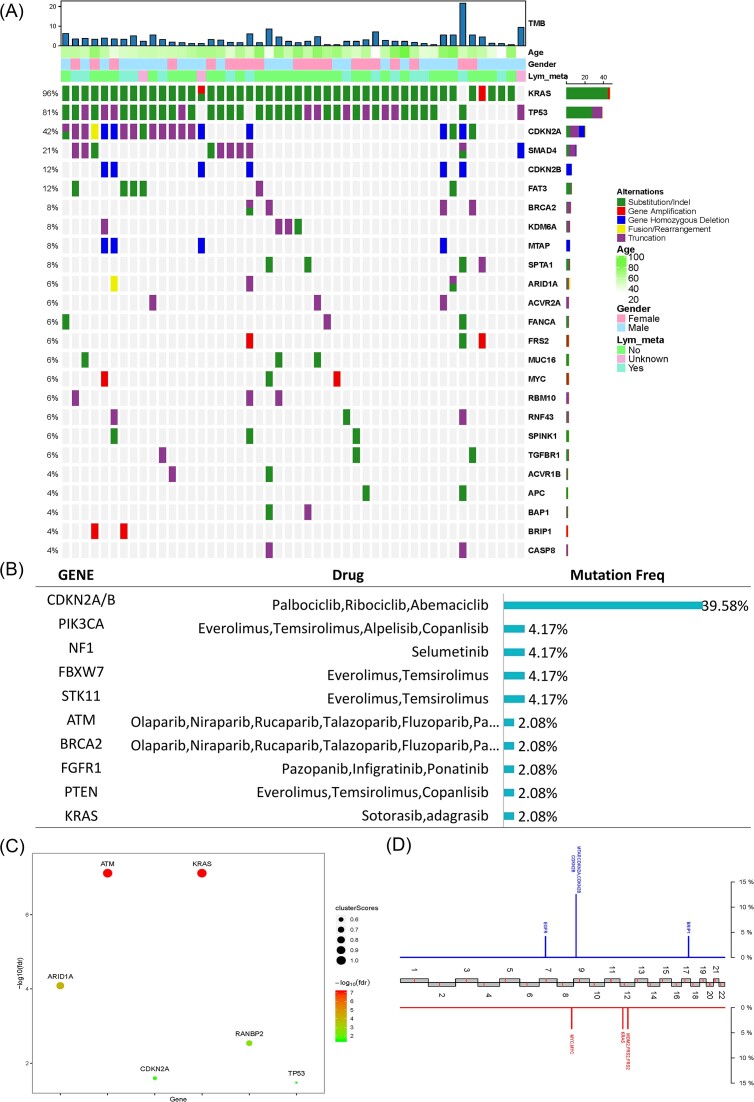
Figure 2.
Genomic landscape of 48 ASCP patients. (A) The features of GAs. The panel shows the matrix of mutations coloured according to the type of mutation. Each column denotes an individual patient and each row represents a gene. (B) The distributions indicate GAs. (C) Onco-driver genes represented in the ASCP samples. (D) Recurrent copy number variations. Red represents copy number gains and blue represents losses.

