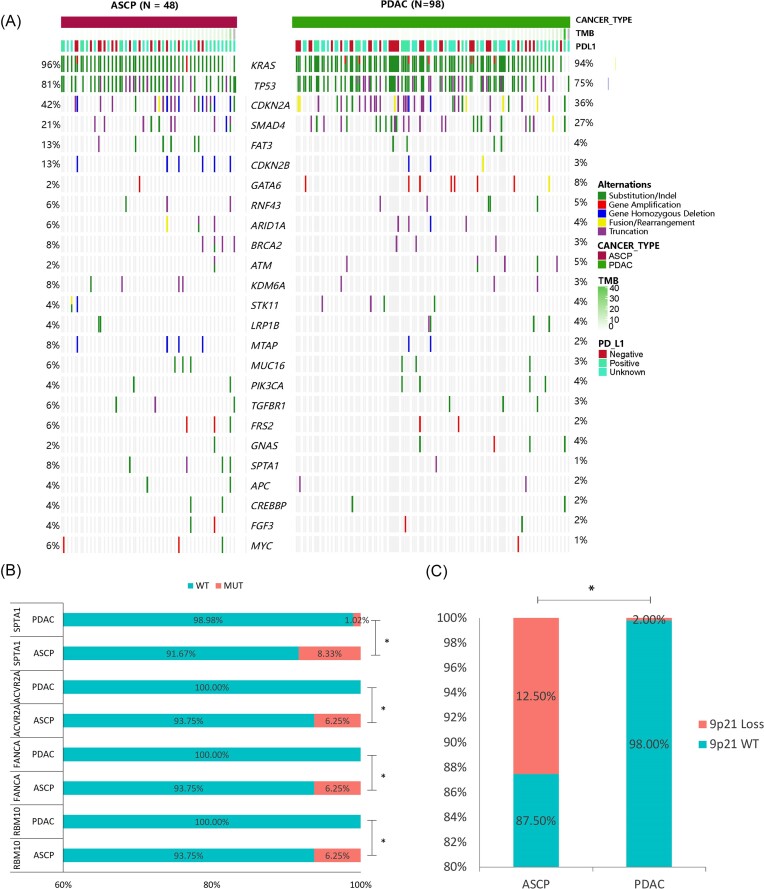
Figure 3.
Comparison of genetic characterization between ASCP and PDAC. (A) The profiles of GAs. Dark red represents 48 ASCP patients and green represents 98 PDAC patients. The panel shows the matrix of mutations coloured according to the type of mutation. Green: substitution/indel; red: gene amplification; blue: gene homozygous deletion; yellow: fusion/rearrangement; purple: truncation. (B) Genes with a significant difference in mutation frequency between ASCP and PDAC. (C) Comparison of the 9p21 homologous deletion ratio in ASCP and PDAC. *P<0.05.

