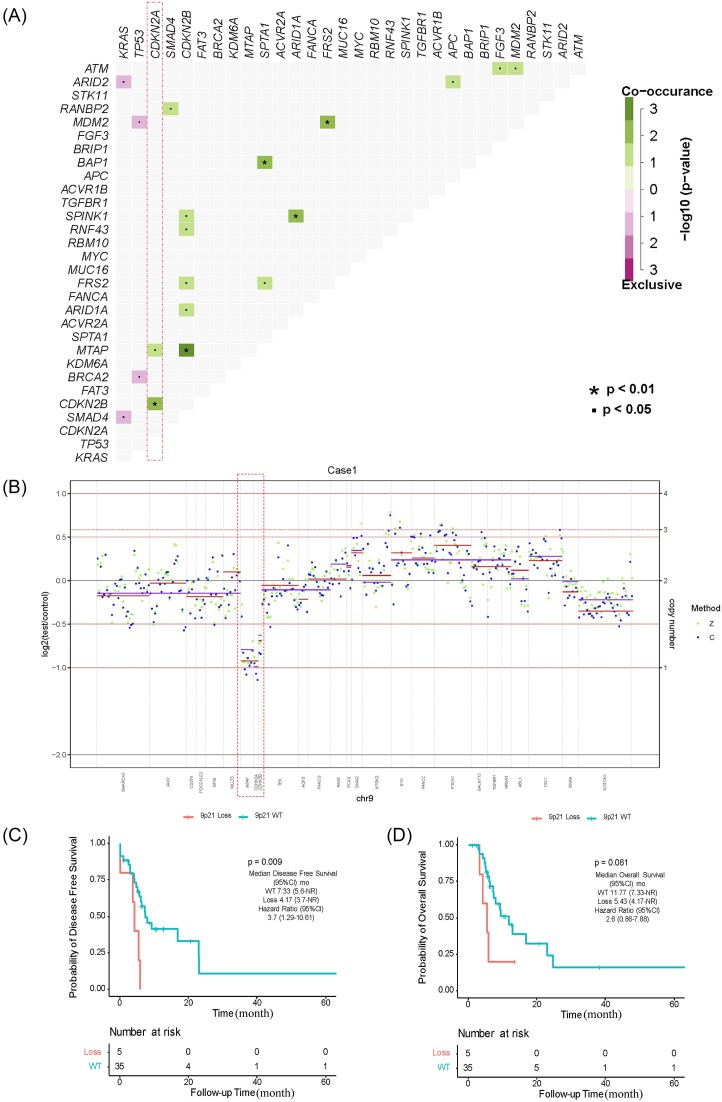
Figure 4.
Genetic characteristics and prognosis of 9p21 loss. (A) Gene co-mutations in ASCP. (B) Example of copy number variation data of chromosome 9. Z and C represent two software algorithms. Genomic region is presented according to the assay used (purple = Z-score, red = C-score) and ordered according to genomic position. Blue spots/purple lines and green spots/red lines indicate the average log-ratio in Z and C, respectively. Lines indicate the average log-ratio in a segment. (C, D), Kaplan‒Meier analysis of disease-free survival and overall survival for 9p21, respectively. The hazard ratio was obtained using the Cox proportional hazards test. Loss, homozygous deletion type.

