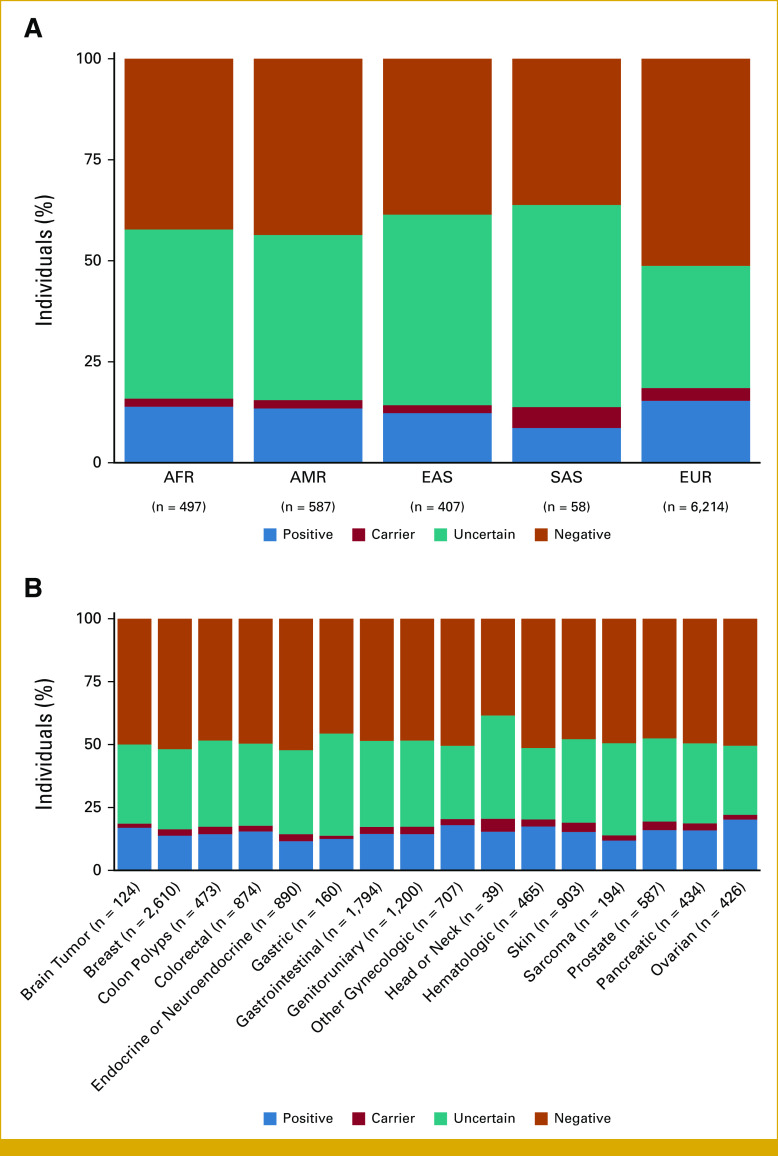
FIG 2.
Genetic test results by (A) genomic ancestry and (B) personal history of other cancers. Proportion is based on the number of patients in each category, with the total number of patients in each category reported on the x-axis. Of note, 20 patients (0.02% of cohort) did not demonstrate a clearly predominant genomic ancestry and are not included in the analysis in panel (A). AFR, African; AMR, Ad Mixed American; EAS, East Asian; EUR, European; SAS, South Asian.

