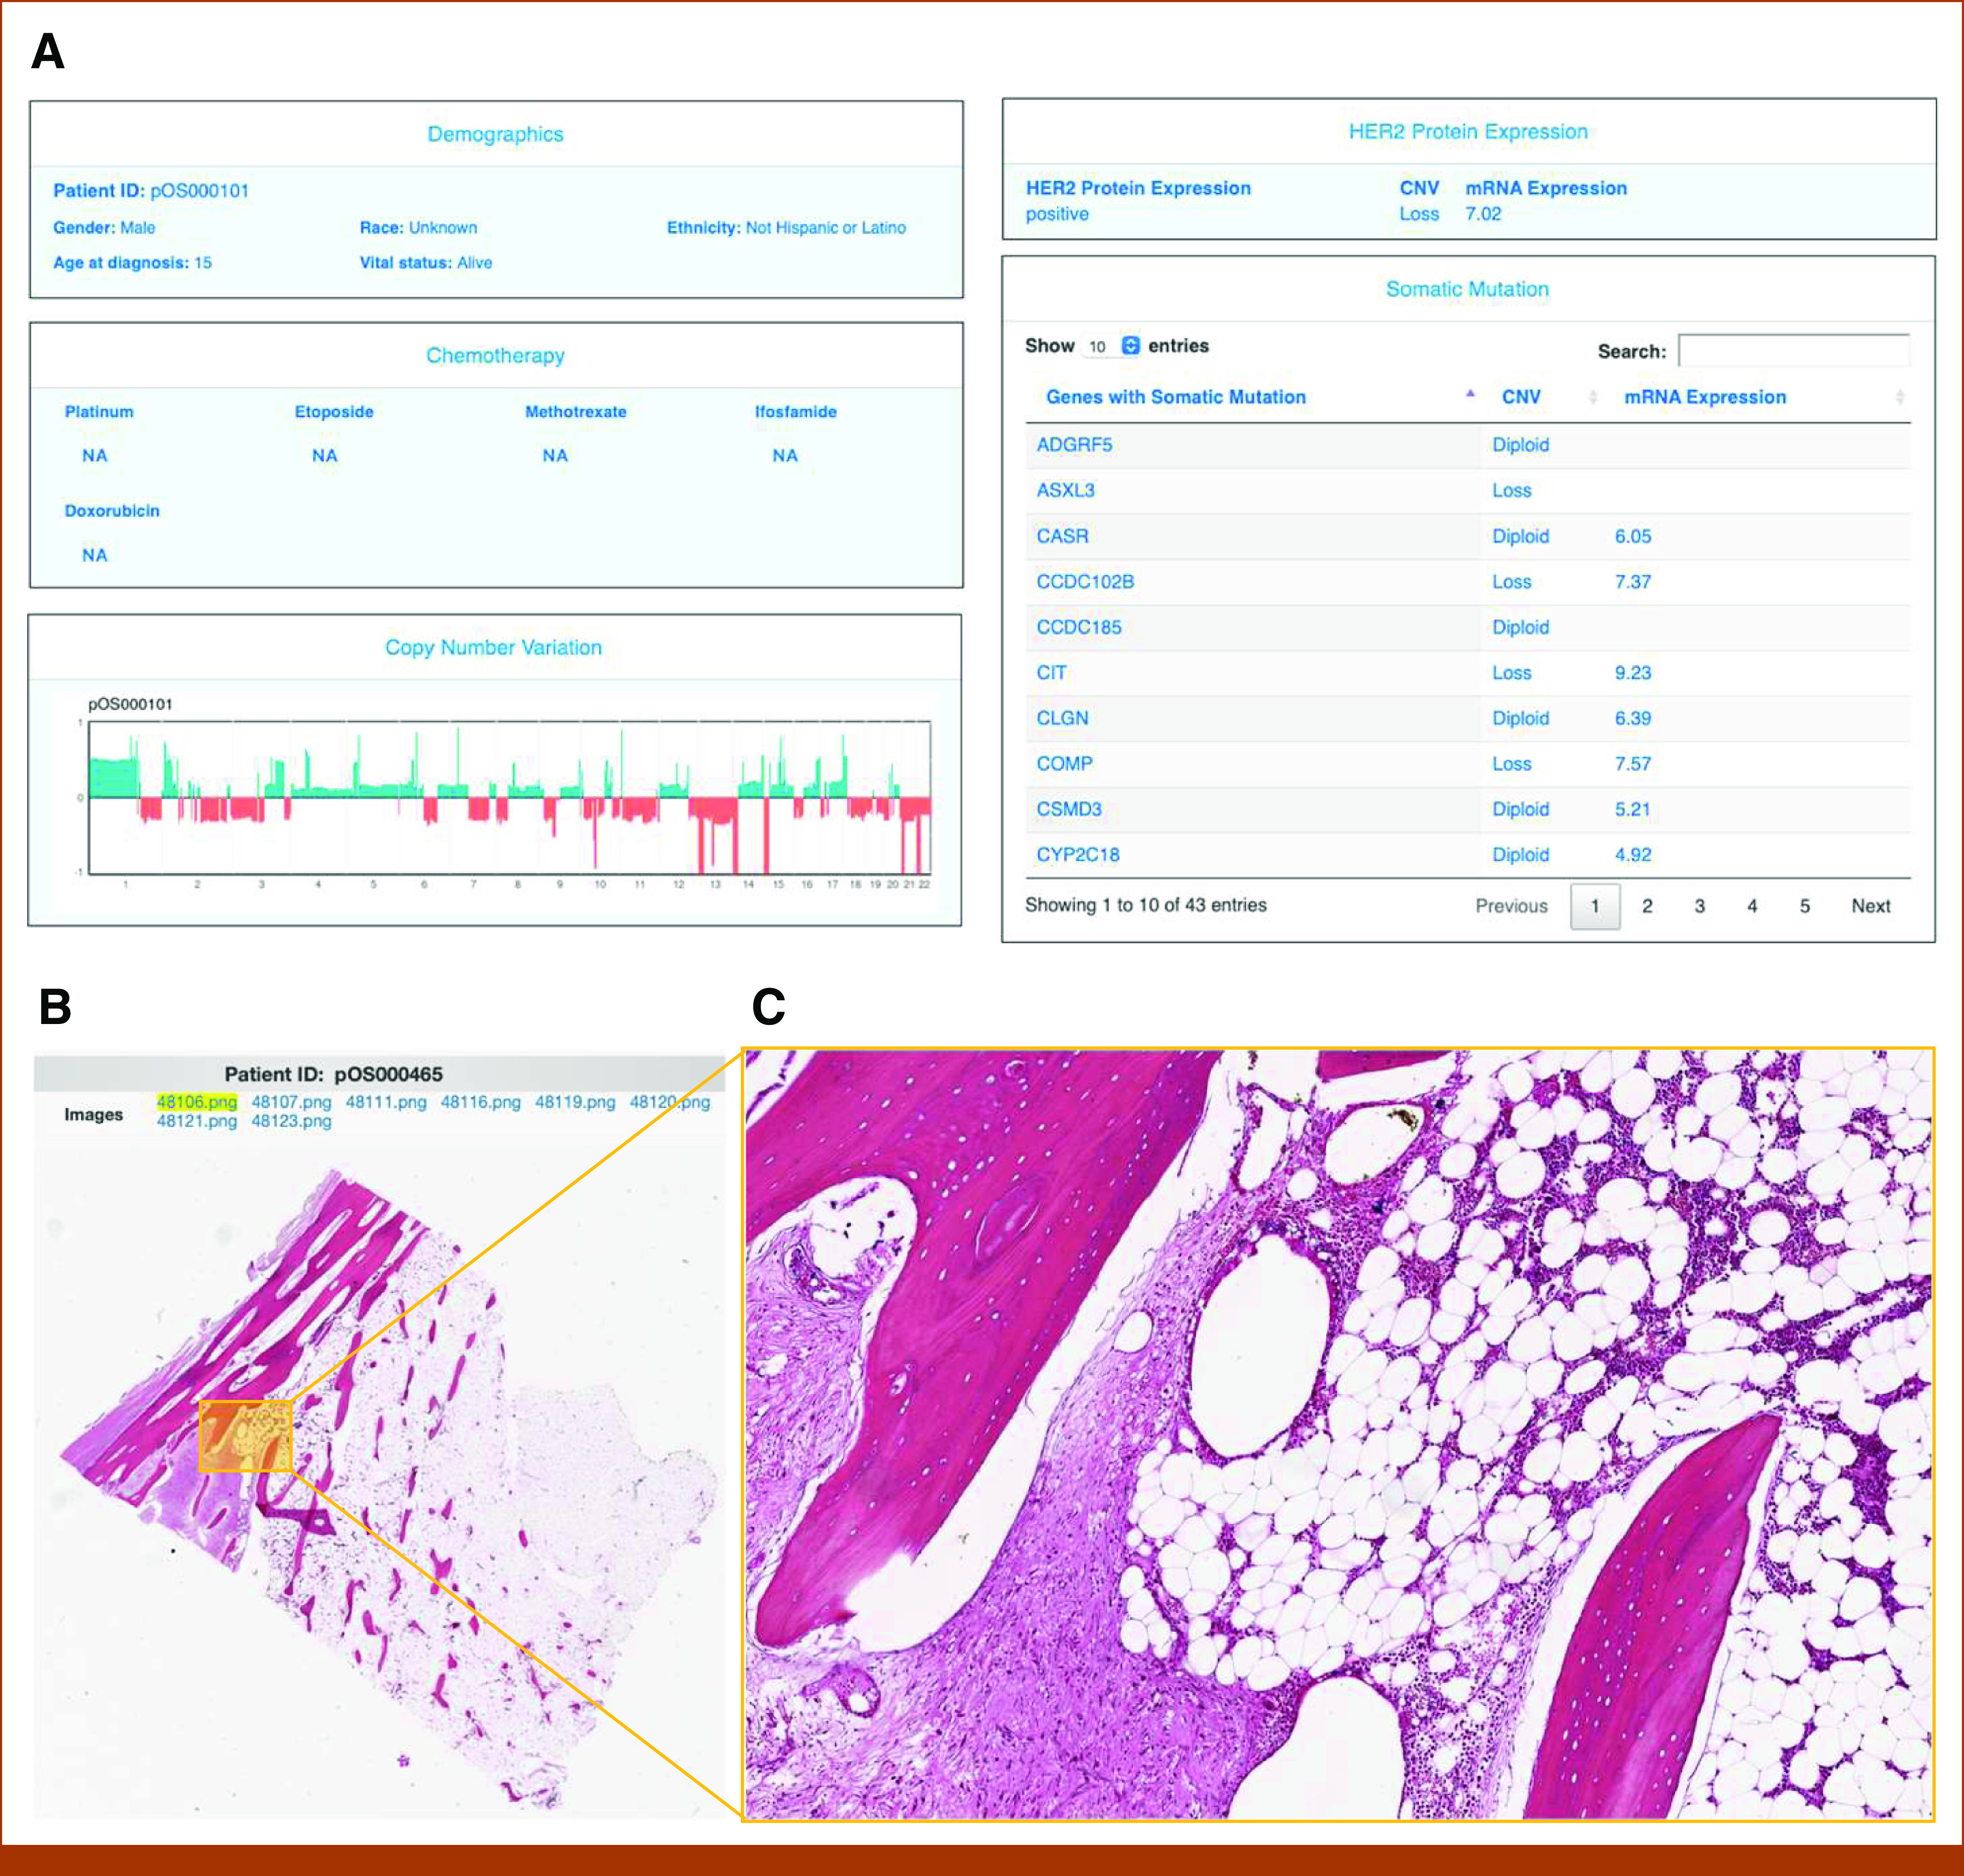
FIG 3.

Patient Dashboard module and Image Viewer module on the OSE. (A) Individual patient-level data is displayed by sections, including demographics, chemotherapy, HER2 protein expression, an overview graph of CNV, and a table of CNV and mRNA expression status for genes with somatic mutation. This example is obtained from patient pOS000101. Access to this module is limited to registered users only. CNV graph: x-axis shows the position of a genomic region; y-axis shows CNV signatures of the region; green indicates copy-number gain; red indicates copy-number loss. The gene mutation table can be sorted and searched by users. (B) High-resolution, whole-slide tissue images are displayed for each patient. In this example, eight H&E images are available for the selected patient. (C) In-browser zoom-in action can smoothly focus on regions of interest with cell-level details. This example is obtained from patient pOS000465. Access to this module is limited to registered users only. CNV, copy-number variation; H&E, hematoxylin and eosin; HER2, human epidermal growth factor receptor 2; ID, identifier; NA, not applicable; OSE, Osteosarcoma Explorer.
